7 QC TOOLS
7 QC TOOLS. 1. Check sheet 2. Pareto Diagram 3. Cause & Effect Diagram 4. Histogram 5. Stratification 6. Scatter Diagram 7. Control Chart/ Graphs. Facts or figures from which conclusions can be drawn. A basis for reasoning,

7 QC TOOLS
E N D
Presentation Transcript
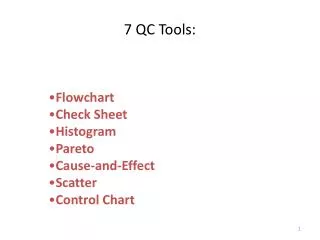
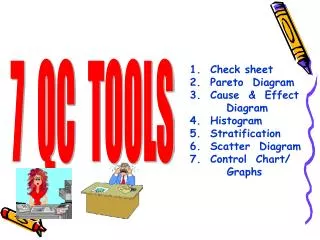
7 QC TOOLS 1. Check sheet 2. Pareto Diagram 3. Cause & Effect Diagram 4. Histogram 5. Stratification 6. Scatter Diagram 7. Control Chart/ Graphs
Facts or figures from which conclusions can be drawn. A basis for reasoning, discussion or calculation. Data Why Gather Data? 1. To identify problems to work on. 2. To analyze the selected problem as in - assessing extent of problem - identifying patterns - verifying probable causes 3. To prevent problems from arising or recurring. 4. To select possible action plans 5. To establish effectiveness of implemented solutions.
A check sheet is a form prepared to facilitate checking off or marking. The function of a check sheet is to provide a systematic technique for recording observations and should be designed so that data can be posted on them and used with minimum effort. Check sheets serve many purposes and should be designed so data can be posted on them and used with minimum effort. Checksheet 1. Agree as to what event is being observed. 2. Decide on the time period during which data will be collected. 3. Design a form which is clear complete and easy to use. 4. Collect data consistently and honestly. Constructing a checksheet
Step 1. Select the standard for comparison, e.g., annual cost, frequency of defects Step 2. Select the time period to be studied. Step 3. Gather data. Use a checklist Step 4. Transfer information from a check sheet to a column graph arranged in descending order. Step 5. Summarize data from the check sheet to construct the cumulative line. A Pareto Diagram is a special form of vertical graphs which helps us to determine which problems to solve in what order. Doing a Pareto diagram based upon check sheets or other forms of data collection helps us direct our attention and efforts to truly important problems. Pareto Diagram How to construct
1. To highlight main problems. Different Uses
Different Uses 2. To compare problems through the use of different measurement scales. Customer complaints $ loss No. Wrong spec Wrong spec
Different Uses 3. To aid in root cause analysis (Multi-level Pareto) Effect Cause
Multi Level Pareto Illustration 1ST LEVEL 2ND LEVEL
Multi Level Pareto Illustration 3RD LEVEL 4TH LEVEL
Multi Level Pareto Illustration 5TH LEVEL
Different Uses 4. To evaluate before and after corrective action. Effective
Problem, Effect or Result Cause and Effect Diagram A cause and effect diagram is a picture composed of lines and arrows to represent relationships between effects and its causes. A primary use for Cause and Effect diagrams is to analyze existing problems or situations so that corrective measures can be taken. The Cause and Effect diagram is a valuable too to use in sorting out “non-contributing” causes; leaving only the “true” causes. How to construct Step 1. Pick a result, effect or problem to be solved. Virtually display problem statement.
Problem, Effect or Result How to construct Cause & Effect Diagram Step 2. Categorize causes by major elements and put boxes around them. Start with 4Ms and 1E (Man, Machine, Materials, Method, Environment) Machine Man Method Materials Environment
Machine Man Problem, Effect or Result Method Materials Environment How to Construct a Cause & Effect Diagram Step 2. Categorize causes by major elements and put boxes around them. Start with 4Ms and 1E (Man, Machine, Materials, Method, Environment)
Problem, Effect or Result How to Construct a Cause & Effect Diagram Step 2. Add smaller branches to main causes and continue adding until all possible causes are exhausted. • Use brainstorming to generate a large number of specific causes in each category. • Ask who, why, what, when, where, or how to stimulate thinking.
Brainstorming It is a creative process for generating a large quantity of ideas utilizing a group.
How to Use a Cause and Effect Diagram Step 1. Compare all causes (What is) against operational standard (What should be). Circle the causes for causing “bad” effect. The diagram can be used to evaluate if operational standard is inadequate.
How to Use a Cause and Effect Diagram Find out which of the circled causes have a significant effect on the problem. How? 1. Use technical knowledge 2. Obtain opinion 3. Verify through data gathering 4. Do more analysis of data 5. Possibly design an experiment Step 2.
How to Use a Cause and Effect Diagram Steps 3. Construct a plan on how the problems are to be resolved. * the plan should include activities, timetable and person responsible. 4. Because the Cause & Effect diagram reflects graphically the results of investigating a problem, it is a good idea to post it in the work area so that everyone can see why action is necessary. 5. Continue improvements and revisions to improvements. 3,4 & 5
Histogram A Histogram is a graph which shows the frequency of occurrence in a number of related measurements. A histogram reveals how measurements vary from one another and displays the distribution of data. It can be used to compare sample results with specification.
How to Construct a Histogram Step 1. Gather data. Minimum of 50 observations.
How to Construct a Histogram Step 2. Identify the largest and smallest measurement. Compute the range. Range = Maximum - Minimum reading reading Range = 0.44 - 0.36 = .08
How to Construct a Histogram Step 3. Determine how many classes are required to make a histogram. Compute for the class interval. R .08 Class Interval = ---- = ------ K 5 Class Interval = .016 or .02 K is a constant determined from a table.
How to Construct a Histogram For Constant K, DATA and Class Amounts Number of Appropriate No. Observations of Classes 50 5 - 7 51 - 100 6 - 10 101- 250 7 - 12 Over 250 10 - 20
How to Construct a Histogram Step 4. Determine the boundary line between classes. Class Class Interval 1 0.36 - 0.37 2 0.38 - 0.39 3 0.40 - 0.41 4 0.42 - 0.43 5 0.44 - 0.45
How to Construct a Histogram Step 5. Transfer data to a tally sheet Tally Sheet
How to Construct a Histogram Step 6. Transform data from tally sheet to a Histogram.
Scatter Diagram A Scatter Diagram is used to study the possible relationships between one variable and another. The Scatter Diagram is used to test for possible cause and effect relationships. It cannot prove that one variable causes the other, but it does make it clear whether a relationship exists and the strength of that relationship.
Variable 2 Variable 1 Scatter Diagram A Scatter Diagram is set up whereby the horizontal axis (X-axis) represents the measurement values of one variable and the vertical axis (Y-axis) represents the measurement of the second variable.
How to Construct a Scatter Diagram Step 1. Collect 50 to 100 paired samples of data that you think may be related. Construct a data sheet as follows: Relationship between Manual & Auto Titration (Sn + 2)
50 43 42 40 Auto g/l y 40 42 43 44 45 46 47 48 How to Construct a Scatter Diagram Step 2. Draw the horizontal and Vertical Axes of the diagram. Manual g/l X
How to Construct a Scatter Diagram Step 3. Plot the data on the diagram. If you find the values being repeated, circle that point as many times as appropriate.
Scatter Diagram Patterns NegativelyCorrelated Positively Correlated NoCorrelation
Stratification • Stratification is a process of classifying • data into subgroups based on categories • and characteristics. • Helps analyze cases in which data actually masks the real facts. • Breaks down single numbers into meaningful categories or classifications to focus on the corrective action.
When to Stratify? 1. During data gathering to design check sheets, create checklist, scatter diagram and cause and effect diagram. 2. During data analysis when using histograms, pareto charts, scatter diagrams and cause and effect analysis. Stratification break down single numbers into meaningful categories or classifications to focus on corrective action.
What is a Control Chart? Control Chart is a graphic representation of a process. Sample averages are plotted on the chart. Statistically determine the upper and lower control limits drawn on either side of the process average. Makes it possible to tell if a process is functioning normally and to see immediately if malfunctioning has occurred.