Download
1 / 7
80 likes | 101 Vues
Explore access, cost-related problems, preventive care, and quality of care issues faced by low-income and uninsured adults through statistics from the Commonwealth Fund Biennial Health Insurance Survey (2010).

E N D
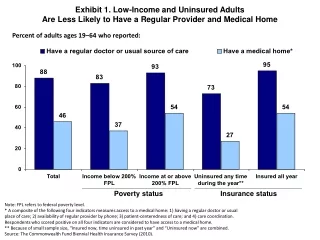
Exhibit 1. Low-Income and Uninsured Adults Are Less Likely to Have a Regular Provider and Medical Home Percent of adults ages 19–64 who reported: Poverty status Insurance status Note: FPL refers to federal poverty level. * A composite of the following four indicators measures access to a medical home: 1) having a regular doctor or usual place of care; 2) availability of regular provider by phone; 3) patient-centeredness of care; and 4) care coordination. Respondents who scored positive on all four indicators are considered to have access to a medical home. ** Because of small sample size, “Insured now, time uninsured in past year” and “Uninsured now” are combined. Source: The Commonwealth Fund Biennial Health Insurance Survey (2010).
Exhibit 2. Low-Income and Uninsured Adults Report High Rates of Cost-Related Access Problems Percent of adults ages 19–64 who reported any of four cost-related access problems*: Poverty status Insurance status Notes: FPL refers to federal poverty level. Percentages are adjusted for age, sex, race, and health status. * Respondent had at least one of four access problems because of cost: did not fill prescription; skipped recommended test, treatment, or follow-up; had a medical problem, did not visit doctor/clinic; and did not get needed specialist care. ** Because of small sample size, “Insured now, time uninsured in past year” and “Uninsured now” are combined. ^ Significant difference compared with income at or above 200% FPL (p <0.05 or better). ^^ Significant difference compared with insured all year (p <0.05 or better). Source: The Commonwealth Fund Biennial Health Insurance Survey (2010).
Exhibit 3. Low-Income and Uninsured Adults Are Less Likely to be Up-to-Date with Preventive Care Percent of adults ages 19–64 who reported receiving preventive care screenings*: Poverty status Insurance status Notes: FPL refers to federal poverty level. Percentages are adjusted for age, sex, race, and health status. * Pap test in past year for females ages 19–29, past three years age 30+; colon cancer screening in past five years for adults ages 50–64; mammogram in past two years for females ages 50–64; blood pressure checked in past year; cholesterol checked in past five years (in past year if has hypertension or heart disease). ** Because of small sample size, “Insured now, time uninsured in past year” and “Uninsured now” are combined. ^ Significant difference compared with income at or above 200% FPL (p <0.05 or better). ^^ Significant difference compared with insured all year (p <0.05 or better). Source: The Commonwealth Fund Biennial Health Insurance Survey (2010).
Exhibit 4. Low-Income and Uninsured Adults Are Less Likely to Rate the Quality of Their Care as Excellent or Very Good Percent of adults ages 19–64 who rated the quality of their care as excellent or very good*: Poverty status Insurance status Notes: FPL refers to federal poverty level. Percentages are adjusted for age, sex, race, and health status. * Respondent rated the quality of care received in the past 12 months as excellent/very good. ** Because of small sample size, “Insured now, time uninsured in past year” and “Uninsured now” are combined. ^ Significant difference compared with income at or above 200% FPL (p <0.05 or better). ^^ Significant difference compared with insured all year (p <0.05 or better). Source: The Commonwealth Fund Biennial Health Insurance Survey (2010).
Exhibit 5. When Low-Income Adults Have a Medical Home and Insurance, Their Rates of Having Cost-Related Access Problems Decline Percent of adults ages 19–64 with income below 200 percent FPL who reported at least one of four cost-related access problems*: Notes: FPL refers to federal poverty level. Percentages are adjusted for age, sex, race, and health status. * Respondent had at least one of four access problems because of cost: did not fill prescription; skipped recommended test, treatment, or follow-up; had a medical problem, did not visit doctor/clinic; and did not get needed specialist care. ** Because of small sample size, “Insured now, time uninsured in past year” and “Uninsured now” are combined. ^ Significant difference compared with insured all year with medical home (p <0.05 or better). Source: The Commonwealth Fund Biennial Health Insurance Survey (2010).
Exhibit 6. When Low-Income Adults Have a Medical Home and Insurance, Their Rates of Getting Preventive Care Improve Percent of adults ages 19–64 with income below 200 percent FPL who reported receiving preventive care screenings*: Notes: FPL refers to federal poverty level. Percentages are adjusted for age, sex, race, and health status. * Pap test in past year for females ages 19–29, past three years age 30+; colon cancer screening in past five years for adults ages 50–64; mammogram in past two years for females ages 50–64; blood pressure checked in past year; cholesterol checked in past five years (in past year if has hypertension or heart disease). ** Because of small sample size, “Insured now, time uninsured in past year” and “Uninsured now” are combined. ^ Significant difference compared with insured all year with medical home (p <0.05 or better). Source: The Commonwealth Fund Biennial Health Insurance Survey (2010).
Exhibit 7. When Low-Income Adults Have a Medical Home and Insurance, Their Rating of Quality of Care Improves Percent of adults ages 19–64 with income below 200 percent FPL who rated the quality of their care as excellent or very good*: Notes: FPL refers to federal poverty level. Percentages are adjusted for age, sex, race, and health status. * Respondent rated the quality of care received in the past 12 months as excellent/very good. ** Because of small sample size, “Insured now, time uninsured in past year” and “Uninsured now” are combined. ^ Significant difference compared with insured all year with medical home (p <0.05 or better). Source: The Commonwealth Fund Biennial Health Insurance Survey (2010).