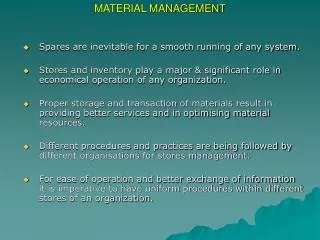
Inventory Management & Independent Demand (b)
250 likes | 417 Vues
Inventory Management & Independent Demand (b). Margaret Farrell + Text Books; Heizer + Slack et al. Steady and predictable demand (d). Order quantity = Q. Slope = demand rate (d). Average inventory. =. Q 2. Q D. Instantaneous deliveries at a rate of.

Inventory Management & Independent Demand (b)
E N D
Presentation Transcript
Inventory Management & Independent Demand (b) Margaret Farrell + Text Books; Heizer + Slack et al inventory management
Steady and predictable demand (d) Orderquantity = Q Slope = demand rate (d) Average inventory = Q 2 Q D Instantaneous deliveries at a rate of Inventory profiles chart the variation in inventory level Inventory level Time D Q per period inventory management
Plan A Q = 400 Average inventory for plan A = 200 Plan B Average inventory for plan B = 50 Q = 100 0.1 yr 0.4 yr Two alternative inventory plans with different order quantities (Q) Demand (D) = 1000 items per year 400 Inventory level 100 Time inventory management
Total costs Holding costs Order costs Economic order quantity (EOQ) Traditional view of inventory-related costs 400 350 300 250 200 Costs 150 100 50 100 300 50 200 400 250 150 350 Order quantity inventory management 400
Slope = P – D Slope = D M Q P Inventory profile for gradual replacement of inventory Source: Alamy/ArchivBerlin Fotoagentur GmbH Order quantity Q Inventory level Time inventory management
Shortages Inventory planning allowing for shortages Inventory level Time inventory management
Re-order level Re-order point Order lead time The re-order point Demand (D) = 100 items per week 400 300 Inventory level 200 100 0 0 1 2 3 4 5 6 7 8 Time inventory management
Re-order level (ROL) Distribution of lead-time usage d1 d2 t2 t1 Safety stock(s) helps to avoid stock-outs when demand and/or order lead times are uncertain Q Inventory level ? S Time inventory management
0.4 0.4 0.3 0.3 Probability Probability 0.2 0.2 0.1 0.1 0 0 5 4 110 140 3 130 2 120 1 Order lead time Demand rate 0.4 0.3 Probability 0.2 0.1 0 200-299 100-199 400-499 300-399 600-699 500-599 700-799 Lead-time usage The probability distributions for order lead time and demand rate combine to give the lead-time usage distribution inventory management
Qm Q1 Q2 Q3 t1 t2 t3 Periodic Review System A periodic review approach to order timingwith probabilistic demand and lead time Inventory level T0 T1 T2 T3 Time tf tf tf inventory management
Class A items Class B items Class C items ABC analysis or Pareto curve for stocked items Source: Howard Smith Paper Group 100 90 80 70 60 Percentage of value of items 50 40 30 20 10 90 80 100 70 30 10 40 50 60 20 Percentage of types of items inventory management
ABC Analysis • Divides inventory into three classes based on annual dollar volume • Class A - high annual dollar volume • Class B - medium annual dollar volume • Class C - low annual dollar volume • Used to establish policies that focus on the few critical parts and not the many trivial ones inventory management
Class B items – the next 30% or so of medium-value items which account for around 10% of the total stock value Class A items – the 20% or so of high-value items which account for around 80% of the total stock value Class C items – the remaining 50% or so of low-value items which account for around the last 10% of the total stock value Inventory classifications and measures inventory management
ABC Analysis inventory management
ABC Analysis inventory management
A Items 80 – 70 – 60 – 50 – 40 – 30 – 20 – 10 – 0 – Percent of annual dollar usage B Items C Items | | | | | | | | | | 10 20 30 40 50 60 70 80 90 100 Percent of inventory items ABC Analysis Figure 12.2 inventory management
ABC Analysis • Other criteria than annual dollar volume may be used • Anticipated engineering changes • Delivery problems • Quality problems • High unit cost inventory management
ABC Analysis • Policies employed may include • More emphasis on supplier development for A items • Tighter physical inventory control for A items • More care in forecasting A items inventory management
The maintenance department for a small manufacturing firm has responsibility for maintaining an inventory of spare parts for the machinery it services. The parts inventory, unit cost and annual usage are as set out in the table below.The department manager wants to classify the inventory parts according to the ABC system to determine which stocks of parts should be monitored more closely Example 1 inventory management
EXAMPLE 2 inventory management
EXAMPLE 2 inventory management