Function
Functions act like magic boxes where inputs yield specific outputs consistently. Explore the concepts of domains, ranges, and function graphs to understand mathematical relationships. Learn about linear and nonlinear functions. Discover basic operations on functions and the role of variables in equations.

Function
E N D
Presentation Transcript
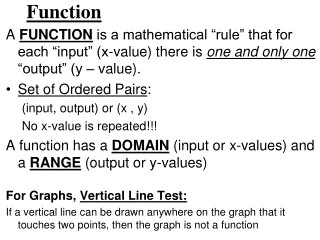
什麼是函數? • 函數像一個魔術師的戲法箱,適當“輸入”就一定會有“輸出”,而且相同的輸入必定會得到相同的輸出。
時間 距離 函數 Ex:輸入的值是車子行駛的時間,輸出的 值是車子行駛的距離 得到一個函數描述該車的行駛狀況
Why do we need domains and ranges? Domains and ranges are important ideas that will help us to understand the relationship between two variables in an equation, especially when we begin graphing.
距離函數: 即 Ex:車速固定為 90 /hr.(等速運動), 1 分鐘後,車子行駛的距離為 1.5 公里。2 分鐘後,車子行駛的距離為 3 公里。3 分鐘後,車子行駛的距離為 4.5 公里。4 分鐘後,車子行駛的距離為 6 公里。
由這個函數圖形看出當輸入值為 1 分鐘時,輸出值對應到 1.5 公里;輸入值為 2 分鐘時,輸出值則對應至 3 公里。
函數觀念的產生使數字能夠描述“運動”或 動態的事物。
如果行車速度固定為每小時v0 公里, 距離函數則為 公里 (t 以分鐘為單位),函數圖形都會是一條直線。而且這條直線的斜率為
是f (t)從t2到t1之間的平均速度,也是平均變化率。
這裡的運動為等速度,所以每一瞬間的速度也等於平均速度。 當函數圖形無法以一條直線來表示,對於這樣的函數,能發現它每一刻的“瞬間速度”嗎?
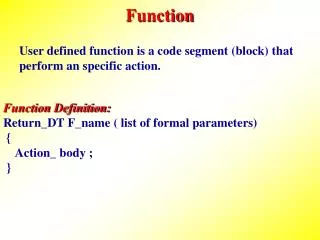
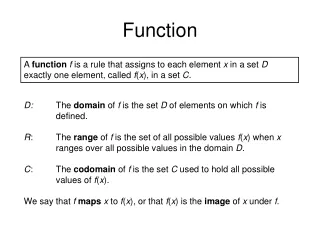
What is a function? In general, a compact description of the data, that gives the values of some of the fields in terms of the others, is called a function. A variable y is a function of x if a relation between x and y produces exactly one value of y for each value of x.
The variable x is called the independent variable.If y = f(x) we call y thedependent variable. A function can be specified: numerically:by means of a table algebraically: by means of a formula graphically: by means of a graph
A Numerically Specified Function: Ex: Suppose that the function f is specified by the following table. Then, f(0) is the value of the function when x = 0. f(0) = 3.01 Look on the table where x = 0 f(1) = -1.03 Look on the table where x = 1 and so on.
An Algebraically Specified Function: Ex:Suppose that the function f is specified by f(x) = 3x2- 4x + 1. Then f(2)= 3(2)2- 4(2) + 1 Substitute 2for x= 12 - 8 + 1 = 5 f(-1)= 3(-1)2- 4(-1) + 1 Substitute -1for x= 3 + 4 + 1 = 8
Let's take a look at an equation that has two unknown variables. In order to graph or plot this function, we have to give X a fixed value and substitute X into the equation to find out what the value of Y would be. In other words, a function "maps" one type of value to another. The set X is the domain and the set y is the range of the function. How do we find Domains & Ranges
Suppose that we let X be 0, then Similarly, if we let X be 1, then
If we let X be -3, -2, -1, 0, 1, 2, 3 respectively and substitute each value of X into the equation, then the set of ordered pairs would be: If we use the set of ordered pairs above to plot the graph, the graph would be:
What is the domain and range associated with the given function?
Thedomainfor the above function is the set of all real numbers. If we examine the set of ordered pairs, it will include{..., -3, -2, -1, 0, 1, 2, 3, ...}. • Therange for the above function is the set of all real numbersgreater than or equal to -3.If we examine the set of ordered pairs, it will include{..., 6, 1, -2, -3, -2, 1, 6, ...}.
What is a Linear Function? A linear function is one whose graph is a straight line. f(x) = mx + b Function form y = mx + bEquation form
What is a Non-Linear Function? Did you notice that the linear function is a polynomial function of degree 1? A quadratic function is a polynomial function of degree 2, defined by an equation of the form y = a x2 + b x + c
Basic operations on functions We can define the four basic operations--sum, difference, product, and quotient--as follows: If the ranges of functions f and g are subsets of the real numbers, then • The sum of f and g, denoted as f+g, is defined as(f+g)(x)= f(x) + g(x) • The difference of f and g, denoted asf-g, is definedas (f-g)(x)= f(x) - g(x)
Basic operations on functions • The product of f and g, denoted as f.g, is defined as (f . g)(x) =f(x) . g(x) • The quotient of f and g, denoted as f/g, is defined as(f/g)(x) = f(x)/g(x) Did you realize that the basic operations on functions are so simple and straightforward?
Ex:If f(x) = x2 - 1, g(x) = x +1, find (f.g)(x) and (f/g)(x) Sol: (f.g)(x) = f(x) . g(x) = (x2 - 1)(x+1) =x3 + x2 - x - 1 (f/g)(x) = f(x)/g(x) = (x2 - 1)/(x + 1) = (x +1)(x -1)/(x+1) = (x - 1)
What is a function? • What is a linear function? • Find (f- g)(x) if f(x)= x3+x and g(x)= x2 +1
The Role of b in the equation y = mx + b Ex:y = 3x - 1 This linear equation has m = 2 and b = -1. setting x = 0 gives y = -1, the value of b. Numerically, b is the value of y when x = 0 Graphically, b is the y-intercept of the graph
the graph cuts the y-axis at b = 2, and goes up 0.5 units for every one unit to the right. Ex:y = 0.5x + 2 so that b = 2 (y-intercept) and m = 0.5 (slope).
negative slope positive slope Graph of y = mx + b
=3 = slope x Ex: y = 3x – 1 Now we know that y increases by 3 for every 1-unit increase in x. Similarly …. In general, y increases by 3x units for every x-unit change in x. Using symbols,y=3 x y
Change in y Rise Change in xRun = m = y =
Ex: Two points, say (x1, y1) and (x2, y2), determine a line in the xy-plane. How do we find its slope? the rise is y = y2- y1 the Run is x = x2-x1
y2- y1 x2-x1 Y x We can compute the slope m of the line through the points (x1, y1) and (x2, y2)using m = =
Quadratic Functions f(x)=ax2+bx + c are called quadratic functions because they involve the second power or square of the variable. Any quadratic function ax2 + bx + c can be written in the form a (x - h)2 + constant. In fact, we have ax2 + bx + c = a[x + b/(2a)]2 + c - b2/(4a2).
Ex: Animation of the method 3x2+5x+2 Ex: Animation of the method 6x2+9x+7
Minimum Value of Quadratic Functions Ex: f(x)= x2-2ax+2a+3 Find the minimum value of the function. Sol: The graphs of the quadratic functions f(x)= x2-2ax+2a+3depend on the parameter "a".
If y = x2-ax + a and the interval of x is • 0 ≤ x ≤ 2, • let M(a)= maximum value of y and • m(a)= minimum value of y • Find M(a) and m(a) • Draw the graph of b=M(a) and b=m(a)
Ex: y= x2-2x+2 Find the minimum value of y. Ex: y= -3/2(x2-2x+2)2 +2(x2-2x+2)+3 Find the maximum value of y.
Exponential Rules • To multiply identical bases, add the exponents. Ex:27 • 29means Ex: 370 •319can be simplified to
To divide identical bases, subtract the exponents. Ex:47 can be written 43 Ex: Simplify 7a10 b2c414a9 bc5
•(520)50 • When there are two or more exponents and only one base, multiply the exponents. Ex:(57)3 can be written 57 • 57 • 57 Ex: Simplify ((27)10)6 Ex: Simplify (57)10 • (52)7 (510)25