Download

1 / 34
400 likes | 799 Vues
Measures of Association. 10/25/2012. Readings. Chapter 7 Tests of Significance and Measures of Association (Pollock) (pp. 169-179) Chapter 11 Doing Your Own Political Analysis (Pollock Workbook) . Homework. Due 10/30/2012 Chapter 4: Pollock Workbook Question 1 A, B, C, D Question 3

E N D
Measures of Association 10/25/2012
Readings • Chapter 7 Tests of Significance and Measures of Association (Pollock) (pp. 169-179) • Chapter 11 Doing Your Own Political Analysis (Pollock Workbook)
Homework • Due 10/30/2012 • Chapter 4: Pollock Workbook • Question 1 • A, B, C, D • Question 3 • A, B • Question 5 • A, B, C, D (a line chart, follow instructions in workbook) • Question 7 • A, B, C
Office Hours For the Week • When • Friday 11-1 • Monday 11-1 • Tuesday 8-12 • And appointment
Course Learning Objectives • Students will be able to interpret and explain empirical data. • As this course fulfills the Computational Skills portion of the University degree plan, students will achieve competency in conducting statistical data analysis using the SPSS software program.
Why Hypothesis Testing • To determine whether a relationship exists between two variablesand did not arise by chance. (Statistical Significance) • To measure the strength of the relationship between an independent and a dependent variable? (association)
Nominal Variables Measures of Association
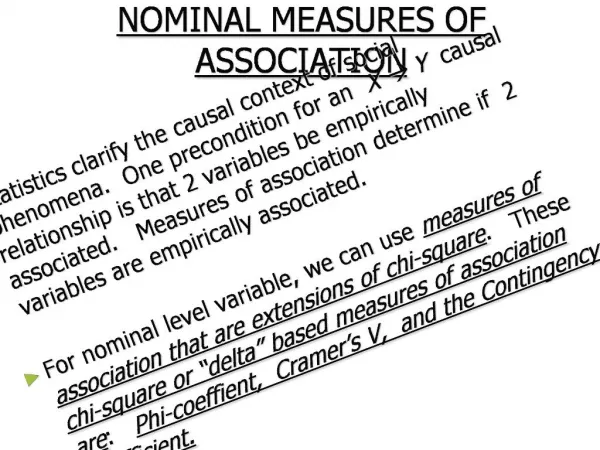
Why Measures of Association • Chi-Square only tests for significance • It does not say how strongly the variables are related • We Use a Measure of Association to Do this
A measure of association is a single number that reflects the strength of the relationship
Problems with Lambda • It fears a TYPE I error so it is very conservative • Lambda can Underestimate relationships, even when there are significant chi-square values. • If the modal category is even, Lambda is pretty useless.
Lambda Underestimating Part II D.V.- obama_win08 IV- Region
Lambda shows Nothing We have a moderate relationship, but it is not significant (small sample)
Easy to Do • How to do it in SPSS • Open States.SAV • Analyze • Descriptive • Cross-Tabs • Click on the Statistics Tab • Highlight your nominal variable statistics • Choose continue
Two Examples Region and Cig Taxes Region and Public Support for Gay Rights
Dichotomous Variables • When a variable takes on two values • In cross-tabs, you can treat dichotomous variables as ordinal!
Measures of association Nominal Ordinal Strength Significance Direction! • Strength • Significance
For Ordinals • strength (measured as the distance away from zero) • significance (measured at the .05 level) • direction- This allows us to determine if we have a positive or negative relationship between our variables.
About these measures • all three are PRE measures. • each has a possible range of -1 to 1. As we approach -1 or 1 the stronger our relationship. A value of 0 (zero), means no relationship. • A positive number indicates a positive relationship, a negative value means a negative relationship.
Somers’ D Why D? Relationship Strengths Guidelines Under .1- very weak .10 and .15 weak .15 and .25 moderate .25-35 moderate-strong .35-.45 strong Above .45 very strong • You are able to test a specific dependent variable • It works for both square and rectangular tables • Use the one in the middle
A POSITIVE RELATIONSHIP • changes in the IV are associated with changes in the same direction for the DV. As the numbers of the IV increase, the numbers in the DV increases.
How it looks in a cross-tab • As people believe abortion should be more available, 1===>3. They are more likely to vote for Obama (0 to 1).
A NEGATIVE RELATIONSHIP • Changes in the IV are associated with changes in the reverse direction in the DV. As the numbers increase in the IV., the numbers in of the DV decrease
In SPSS • As states become more democratic (1-3), they have fewer abortion restrictions (3 to 1)
The Measures of Association A negative value does not mean a weak relationship. LOOK AT THE ABSOLUTE VALUE!!!!
An Example • Maurice Duverger (1957) wrote that "the simple-majority single-ballot system favors the two-party system" and that "multimember districts favor multiple parties". Hypothesis- PR systems will have more parties • D.V. -enpp3_democ (Effective number of parliamentary parties: 3 cats) • IV-pr_sys (PR system)