Measures of Association
150 likes | 519 Vues
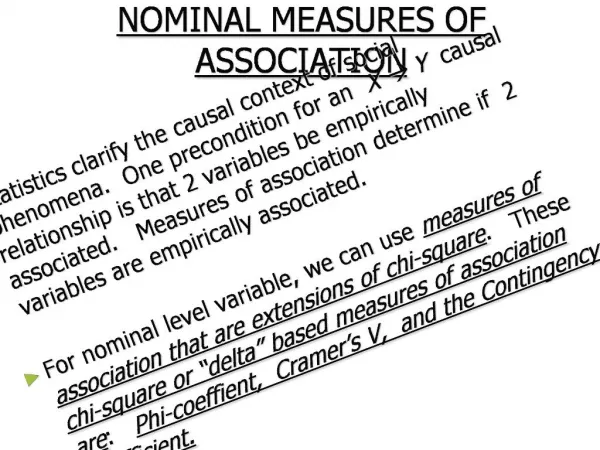
Chapter 18. Measures of Association. Deepak Khazanchi. Bivariate Correlation vs. Nonparametric Measures of Association. Parametric correlation requires two continuous variables measured on an interval or ratio scale

Measures of Association
E N D
Presentation Transcript
Chapter 18 Measures of Association Deepak Khazanchi
Bivariate Correlation vs. Nonparametric Measures of Association • Parametric correlation requires two continuous variables measured on an interval or ratio scale • The coefficient does not distinguish between independent and dependent variables
Bivariate Correlation Analysis • Pearson correlation coefficient • r symbolized the coefficient's estimate of linear association based on sampling data • Correlation coefficients reveal the magnitude and direction of relationships • Coefficient’s sign (+ or -) signifies the direction of the relationship • Assumptions of r • Linearity • Bivariate normal distribution
Bivariate Correlation Analysis • Scatterplots • Provide a means for visual inspection of data • the direction of a relationship • the shape of a relationship • the magnitude of a relationship • (with practice)
Interpretation of Coefficients • Relationship does not imply causation • Statistical significance does not imply a relationship is practically meaningful
Interpretation of Coefficients • Suggests alternate explanations for correlation results • X causes Y. . . or • Y causes X . . . or • X & Y are activated by one or more other variables . . . or • X & Y influence each other reciprocally
Interpretation of Coefficients • Artifact Correlations • Goodness of fit • F test • Coefficient of determination • Correlation matrix • used to display coefficients for more than two variables
Bivariate Linear Regression • Used to make simple and multiple predictions • Regression coefficients • Slope • Intercept • Error term • Method of least squares
Interpreting Linear Regression • Residuals • what remains after the line is fit or (Yi-Yi) • Prediction and confidence bands ^
Interpreting Linear Regression • Goodness of fit • Zero slope • Y completely unrelated to X and no systematic pattern is evident • constant values of Y for every value of X • data are related, but represented by a nonlinear function
Nonparametric Measures of Association • Measures for nominal data • When there is no relationship at all, coefficient is 0 • When there is complete dependency, the coefficient displays unity or 1
Characteristics of Ordinal Data • Concordant- subject who ranks higher on one variable also ranks higher on the other variable • Discordant- subject who ranks higher on one variable ranks lower on the other variable
Measures for Ordinal Data • No assumption of bivariate normal distribution • Most based on concordant/discordant pairs • Values range from +1.0 to -1.0
Measures for Ordinal Data • Tests • Gamma • Somer’s d • Spearman’s rho • Kendall’s tau b • Kendall’s tau c