The Changing Environment
The Changing Environment. Rate of Change. The measurable aspect of a change in the environment (known as a field ) is known as rate of change. A change occurs when the characteristics or properties of the environment have been altered.

The Changing Environment
E N D
Presentation Transcript
Rate of Change The measurable aspect of a change in the environment (known as a field) is known as rate of change. A change occurs when the characteristics or properties of the environment have been altered. The occurrence of change (known as an event) can be instantaneous or gradual. Scientists studying rate of change in the environment will use time and/or space as a frame of reference. Rate of change = change in field value change in time
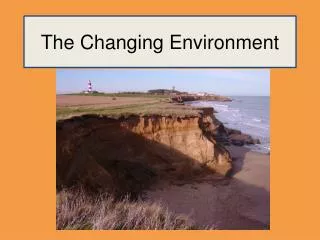
Rate of Change – Sample Problem “An environmental geologist was studying the rate of erosion of a beach cliff in Orient Point. In 2000, the height of the Petty’s Bight cliff was 14.8 m. The height of the cliff was measured again in 2010 and was found to be 11.4 m. How quickly is the Petty’s Bight cliff deteriorating each year?” Rate of change = change in field value change in time Rate of change = 14.8m – 11.4m 10 yrs. Rate of change = 0.34 m/yr.
A graph can enable a scientist to visualize the rate of change for an event in the environment. Rate of Change – Sample Problem Height (m) Years: 2000 - 2010
Rate of Change – Relationship Graphs Scientists can use a graph to visualize data collected. The data collected from two variables can be plotted as a relationship graph DIRECT RELATIONSHIP The comparison between two variables in which both variables exhibit similar properties. Y X Sample of a direct relationship: An increase in air temperature (X) leads to an increase in the kinetic activity of molecules (Y) within the air.
Rate of Change – Relationship Graphs INDIRECT or INVERSE RELATIONSHIP The comparison between two variables in which one variable exhibits a property opposite of the other. Y X Sample of a indirect relationship: As the temperature of a gas increases (X), the density of the gas will decrease (Y).
Rate of Change – Relationship Graphs CYCLIC RELATIONSHIP The comparison between two variables in which one variable exhibits an orderly and repeated property as the property of the other variable increases (usually time). Y X Sample of a cyclic relationship: The number of daylight hours in New York City(Y) will change in a predictable way throughout the year (X).
Rate of Change – Relationship Graphs CONSTANT RELATIONSHIP The comparison between two variables in which one variable changes in property while the other has no effect. Y X Sample of a constant relationship: As the mass of an object increases (X), the density of the object will remain the same (Y).
Interface and Equilibrium in the Environment Changes that occur in an environment result from a flow of energy from one part to another. Ex: The heat from molten rock (loses energy) will alter the properties of adjacent rocks (gains energy). The boundary between two regions with two different properties where energy is exchanged is known as an interface. INTERFACE Though continual changes occur on Earth, there is a natural balance of these changes known as dynamic equilibrium. Ex: Water that leaves the atmosphere as precipitation in one environment, may be replenished as water enters the atmosphere through evaporation in another environment.
Human Impact on the Environment NATURAL RESOURCES Human activity can impact the dynamic equilibrium of the planet in a negative way. Humans extract materials and energy resources from the environment, known as natural resources, for their own use. A pollutant is a substance or energy source that is found in a concentration that can impact life and or property in a harmful way.