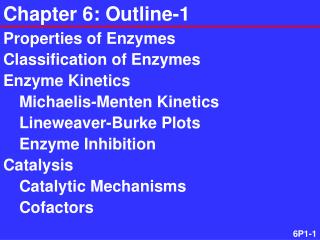
Chapter 6: Outline-1
Chapter 6: Outline-1. Properties of Enzymes Classification of Enzymes Enzyme Kinetics Michaelis-Menten Kinetics Lineweaver-Burke Plots Enzyme Inhibition Catalysis Catalytic Mechanisms Cofactors. Chapter 6: Outline-2. Catalysis cont. Temperature and pH Detailed Mechanisms

Chapter 6: Outline-1
E N D
Presentation Transcript
Chapter 6: Outline-1 • Properties of Enzymes • Classification of Enzymes • Enzyme Kinetics • Michaelis-Menten Kinetics • Lineweaver-Burke Plots • Enzyme Inhibition • Catalysis • Catalytic Mechanisms • Cofactors
Chapter 6: Outline-2 • Catalysis cont. • Temperature and pH • Detailed Mechanisms • Genetic Control • Enzyme Regulation • Covalent Modification • Allosteric Regulation • Compartmentation
Introduction • The proteins which serve as enzymes, Mother Nature’s catalysts, are globular in nature. Because of their complex molecular structures, they often have exquisite specificity for their substrate molecule and can speed up a reaction by a factor of millions relative to an uncatalyzed reaction. This presentation will describe how enzymes function.
6.1 Properties of Enzymes • A catalyst enhances the rate of reaction but is not permanently altered. • Catalysts work by decreasing the activation energy for a reaction. • The structure of the active site of the enzyme (shape and charge distribution) is used to optimally orient the substrate for reaction. • The energy of the enzyme-substrate complex is then closer to the TS.
Activation Energy, Eact Transition state Free energy change (DG) for the reaction • An enzyme speeds a reaction by lowering the activation energy. It does this by changing the reaction pathway.
Activation Energy-2 • An enzyme lowers the activation energy but it does not change the standard free energy change (DG) for the reaction nor the Keq. • A catalyst cannot make an endergonic reaction exergonic or vice versa. • Most enzymes are temperature/pH sensitive and will not work outside their normal temperature/pH range because the enzyme is denatured.
Enzymes Models • In the lock-and-key model, the enzyme is assumed to be the lock and the substrate the key. The two are made to fit exactly. This model fails to take into account the fact that proteins can and do change their conformations to accommodate a substrate molecule.
Enzymes Models-2 Conformation changes Enzyme and substrate do not “fit”. • The induced-fit model of enzyme action assumes that the enzyme conformation changes to accommodate the substrate molecule. Eg.
6.2 Classification of Enzymes • The International Union of Biochemistry (IUB) classifies and names enzymes according to the type of chemical reaction it catalyzes. • Enzymes are assigned a four-number class and a systematic two-part name. • A shorter recommended name is also suggested. • Alcohol dehydrogenase is: • alcohol:NAD+ oxidoreductase • (E.C. 1.1.1.1)
Enzyme Classes • 1. Oxidoreductases catalyze redox reactions. Eg. Reductases or peroxidases • Transferases transfer a group from one molecule to another. Eg. Transaminases, transcarboxylases • 3.Hydrolases cleave bonds by adding water. Eg. Phosphatases or peptidases
Enzyme Classes-2 • 4.Lyases catalyze removal of groups to form double bonds or the reverse. Eg. decarboxylasaes or synthases • 5.Isomerases catalyze intramolecular rearrangements. Eg. epimerases or mutases • 6.Ligases bond two molecules together. Many are called synthetases. Eg. carboxylases
6.3 Enzyme Kinetics • Kinetics is the field of chemistry that studies the rate and mechanism of a reaction. • Rates are usually measured in terms of how many moles of reactant or product are changed per time period. • A mechanism is a detailed step-by-step description of how a reaction occurs at the molecular level.
The Rate Equation-1 • A P • Init. Rate = vo = - D[A] or D[P]Dt Dt • D = change in, [A] = molarity and t is time. • Disappearance of reactants is negative so the quantity has a negative sign to make all rates positive. • First order: Rate = D[A] = k[A]1 • Dt
The Rate Equation-2 • Rate = k [A]xThe rate equals the experimentally determined rate constant, k, times the concentrations of A to some experimentally determined power, x. Values for x are frequently 0, 1 or 2. • ALL RATE EQUATIONS ARE DETERMINED EXPERIMENTALLY!!
The Rate Equation-3 • A + B P • Init. Rate = vo = - D[A] or -D[B] or D[P]Dt Dt Dt • Rate = -k[A]1 [B]1 (overall second order) • If B is water (in large excess) then the reaction appears to be first order in A and is said to be pseudo first order. • Rate’ = k’[A]1 [B]0 = k’[A]1
The Rate Equation-4 A P Zero order: Rate = D[A] = k[A]0 Dt Concentration of A has no effect on rate. • A + A P • Second order: Rate = D[A] = k[A]2 • Dt • Two molecules of A collide to give P.
Rate Equation Example • For the reaction Gly-Gly + H2O 2 Gly • Use the data to determine x and y in the • rate equation: Rate = k[di-G]x[H2O]y • [di-Gly] [H2O] Rate, Ms-1 x 10⁻² • a) 0.1 0.1 1 • 0.2 0.1 2 • c) 0.1 0.2 2 Water constant and di-Gly doubled (a+b). Rate doubles. X=1 Di-Gly constant and water doubles (a+c). Rate doubles. Y=1
Enzyme Rxns: Type 1 • Chymotrypsin cleaves proteins at the COOH end of aromatic side chain AAs. • At low substrate concentrations, the reaction is first order in substrate. • As the concentration of substrate increases, the order changes and approaches zero. • A graph of velocity vs substrate conc. is hyperbolic. (See graph, #22)
Enzyme Rxns: Type 1 Zero order First order • Chymo-trypsin: Hyperbolic plot Conc. At ½ max velocity
Enzyme Rxns: Type 2 • Aspartate transcarbamoylase (ATCase) catalyzes the reacton between aspartate and carbamoyl phosphate. • This reaction leads ultimately to the synthesis of nucleobases needed for DNA and RNA synthesis. • Velocity as a function of aspartate concentration gives a sigmoidal plot. (See #24)
Enzyme Rxns: Type 2 ATCase: Sigmoidal plot
Enzyme Rxns-cont. • The plots for cymotrypsin and aspartate transcarbamoylase should remind us of the oxygen binding curves for myoglobin and hemoglobin respectively. • Thusly, chymotrypsin is a nonallosteric and ATCase is an allosteric enzyme. • We need two different models to explain these enzymes behaviors.
Michaelis-Menten Kinetics-1 • M-M kinetics explains the behavior of nonallosteric enzymes. It assumes an enzyme-substrate complex is formed. At low substrate concentrations, the reaction is first order with respect to substrate. At high substrate concentrations, the enzyme is saturated with substrate. The order is zero and a Vmax occurs.
Michaelis-Menten Kinetics-2 • At low P concentrations (initial rate) • Assumed: k2 negligible vs k1 • Rate of formation of ES equals rate of degradation. • Rate = DP/Dt = k3[ES] • k1[E][S] = (k2 + k3)[ES] (Steady State)
Michaelis-Menten Kinetics-3 • Michaelis and Menten also derived what is now known as the Michaelis-Menten equation. Vmax = max velocity The lower the Km, the greater the affinity for complex formation. An enzymes’s kinetic properties can be used to determine its catalytic efficiency. (Next slide.)
Michaelis-Menten Kinetics-4 • kcat = Vmax/[Et] = turnover number • kcat = molecules of S converted to product per unit time with enzyme saturated • [Et] = total enzyme concentration • V= (kcat / Km) [E][S] • (kcat / Km) is a rate constant where • [S]<< Km and the constant reflects the • combined effect of binding and • catalysis.
Michaelis-Menten Kinetics-5 • Turnover numbers for some enzymes follow. They vary greatly!! • Enzyme kcat (s-1) • Catalase 10,000,000 • Chymotrypsin 190 • Lysozyme 0.5 • Note: catalyse turns over 10 milliion molecules of substrate per sec!!
Michaelis-Menten Kinetics-6 • Substrate concentration at ½ Vmax is termed the KM (Michaelis constant) for the reaction. KM is difficult to measure by this method as Vmax must be estimated. A linear plot gives better results.
Lineweaver-Burk Plot In the form y = mx + b: 1/V is y (V is the measured velocity (rate) of the reaction), 1/[S] is x, KM/Vmax is the slope and 1/Vmax is the y intercept. • A Lineweaver-Burk plot for nonallosteric enzymes gives a straight line and better data to determine KM.
Lineweaver-Burk Plot • A L-B plot of 1/V vs 1/[S] is shown below
Enzyme Inhibition • Inhibitors interfere with enzyme action. • They may be reversible or irreversible. • The three kinds of reversible inhibitors are competitive uncompetitive and noncompetitive . • A competitive inhibitor looks structurally like the substrate and binds to the enzyme at the active site. • An uncompetative inhibitor binds only to the enzyme-substrate complex.
Enzyme Inhibition-2 • A noncompetitive inhibitor does not look like substrate and binds at a site other than the active site.
Competitive Inhibitor-2 • Since a competitive inhibitor competes with substrate for the active site, its influence can be negated with large concentrations of substrate. Thus the Vmax remains constant. • Since the velocity is slower compared to normal substrate concentrations, the slope of the L-B line increases and the KM increases. • The effect of a competitive inhibitor on a L-B plot is shown on slide 42.
Uncompetitive Inhibitor-2 • Since an uncompetitive inhibitor binds only to the enzyme-substrate complex, adding more substrate will increase the rate but not to the original values without inhibitor. • Commonly observer when the enzyme binds to more than one substrate.
Noncompetitive Inhibitor-2 • For a noncompetitive inhibitor, the velocity of the reaction is slowed at all substrate concentrations. Thus the Vmax is permanently lowered. • The slope of the L-B line increases but KM stays constant. • The effect of a noncompetitive inhibitor on a L-B plot is shown on slide 42.
Kinetics: Inhibition Competitive: Vmax same KM changes Noncompetitive: Vmax changes KM same No inhibitor
The kinetic behavior of allosteric enzymes, catalysis in general, and specific enzyme mechanisms are discussed in the next slide series: • Enzymes Part 2