Presentation of the survey
840 likes | 1.07k Vues
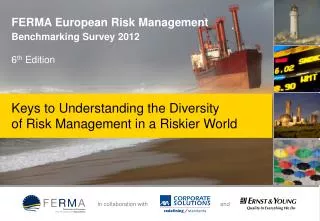
Sixth biennial benchmarking survey conducted by the Federation of European Risk Management Associations (FERMA) in collaboration with AXA Corporate Solutions and Ernst & Young The survey (41 questions) received 809 responses

Presentation of the survey
E N D
Presentation Transcript
Sixth biennial benchmarking survey conducted by the Federation of European Risk Management Associations (FERMA) in collaboration with AXA Corporate Solutions and Ernst & Young The survey (41 questions) received 809 responses • Section 0 – 11 introduction questions and 809 respondents (vs. 782 in 2010) • Section 1 – 12 questions on Risk governance and 429 respondents (vs. 379 in 2010) • Section 2 – 8 questions on Risk Management practices and 480 respondents (vs. 433 in 2010) • Section 3 – 10 questions on Insurance Management and 491 respondents (vs. 451 in 2010) Objectives: • Analyse the evolution of Risk Management environment since 2010 • Determine the level of maturity of Risk Management practices through European companies and compare with 2010 results • Illustrate the link between companies’ performance and Risk Management maturity level • Understand the future of Risk Management and focus on risk appetite triggers • Highlight current insurance issues and expectations Presentation of the survey October 2012
Content 1. • Risk Management fundamentals: • Where do we stand and what’s new? • What are the impacts of the EU 8thCompany Law Directive? 2. Maturity of Risk Management practices 3. Risk priorities and risk appetite triggers 4. How do leading companies use Risk Management to fuel better performance?* 5. Insurance market and management: back to basics • Introduction • Key features: sample composition and respondent profile • Key observations: how to read 2012 results 6. Appendices * New section in 2012 October 2012
Introduction • Key features: sample composition and respondent profile • Key observations: how to read the 2012 results
Introduction An increasing number of respondents 809 782 800 Key facts • 41 questions • January to June 2012 • 22 national Risk Management associations involved 700 600 555 460 500 400 269 300 200 49 100 0 2010 2002 2004 2006 2008 2012 October 2012
Introduction A representative sample of European companies Respondents from all industries Listed and not listed companies Basis: N=809 Basis: N=809 October 2012
Introduction A representative sample of European companies A large array of companies: 55% of companies with a turnover above € 2 billion… … and 59% have more than 5,000 employees Basis: N=809 Basis: N=809 October 2012
Introduction A representative sample of European companies Companies with head offices located in different European countries…. …operating at international level Basis: N=809 Basis: N=809 *Detailed analysis will be provided in the following slides for the countries with more than 5% of the companies’ head offices located in different European coutries and with at least 20 respondents. Country flag symbol will represent relevant country: France= ; UK= ; Germany= ; Italy= ; Benelux (Netherlands+Belgium+Luxembourg)= Specific comment for Germany: due to the small number of respondents, replies do not necessarily represent the level of Risk Management practices in Germany. October 2012
Introduction 72% of the respondents are in charge of Risk Management and/or Insurance Basis: N=809 October 2012
Introduction A sample of experienced respondents without systematic specific qualification 58% of the respondents have no specific qualification in Risk Management… …but 45% have more than 10 years of experience Basis: N=809 Basis: N=809 October 2012
Risk Management fundamentals: • Where do we stand and what’s new? • What are the impacts of the EU 8th Company Law Directive? 1.
Objectives • Impacts of the regulatory environment • Stakeholders’ expectations • Risk Management organisation • Risk Management standards Methodology • Selection and in depth analysis of relevant sample questions extracted from the 2012 survey and comparison with 2010 results (if applicable) 1. Risk Management fundamentals Introduction October 2012
1. Risk Management fundamentals a. Impacts of the regulatory environment * (1/6) Main external factors triggering Risk Management within your company: “legal, regulatory or compliance requirements” considered as the main triggers… (1/2) 61% Legal, regulatory or compliance requirements 33% Clear requirements from shareholders As in the 2010 and 2008 study (see next page), compliance and legal requirements remain the main external factors triggering Risk Management within companies. Corporate social responsibility is still a key concern especially for listed companies while catastrophic events are less considered as a main trigger compared to 2010. 31% Corporate social responsibility 26% Catastrophic event 19% Major insurance issue 17 % Pressure from market 14 % Analysts/rating agencies pressure * Multiple choice question October 2012
1. Risk Management fundamentals a. Impacts of the regulatory environment * (2/6) …but overall, external factors drive the implementation of a Risk Management strategy less than in 2010 (2/2) Major insurance issues clearly emerge as an external factor triggering Risk Management compared to the 2010 study. If compliance and legal requirements remain a major factor triggering Risk Management within companies (61%), the overall trend is driven by a decreasing perception of external triggers. Conversely, companies grant a strengthened trigger to insurance issues (from 13% to 19%). * Multiple choice question October 2012
1. Risk Management fundamentals a. Impacts of the regulatory environment * (3/6) Impacts of the EU 8th Directive on companies’ Risk Management policy (1/4) Most impacted Least impacted • The impacts of the EU 8th Directive are still poorly understood by a large number of Risk and Insurance Managers. • 44% of the listed companies respondents have no opinion or no idea regarding the impact of the EU 8th Directive (in line with 2010 results). • 26% consider that it is not applicable to their organisation (vs. 12% in 2010). • Review/upgrade of Internal Audit and definition of companies’ risk appetite remain marginally impacted by the 8th Directive. • Results highlight that France has been the most impacted by the EU 8th Directive whereas Germany had already a strong level of awareness and was consequently less impacted. * Multiple choice question October 2012
1. Risk Management fundamentals a. Impacts of the regulatory environment * (4/6) Impacts of the EU 8th Directive on Executive Committee operations (2/4) Sufficient time available on the Executive Committee (or equivalent) agenda to present the results of Risk Management reviews? Executive Committee informed of major risks of the company or group at each level? Definition of the risk appetite by the Executive Committee? Approval of risk appetite by the Board? 62% 63% 100% 53% Most informed Most insufficient Most positive The impacts of the EU 8th Directive are still not integrated enough by Executive Committees. The survey results indicate that 45% of respondents consider that their Executive Committee does not devote enough time to review Risk Management topics. To corroborate this observation, the survey highlights that only 52% of Executive Committees are informed of both corporate and division major risks. Risks linked to divisions could be more systematically reported to the Board. Only 5% of the respondents indicate that risks are not reported to the Executive Committee at any level. Furthermore, only 39% of Executive Committees define the risk appetite of their organisation. This low level of involvement leaves room for improvements and enhancement of the application of the EU 8th Directive. Among organisations where the risk appetite has duly been defined by the Executive Committee, 79% obtain the approval from the Board. This means that Boards are receptive to this exercise and willing to validate the strategic decisions taken by the Executive Committee in respect to Risk Management. * Multiple choice question October 2012
1. Risk Management fundamentals a. Impacts of the regulatory environment * (5/6) Impacts of the EU 8th Directive on Executive Committee operations (3/4) Managers formally made responsible for each risk? Risk Management function incorporated into a "corporate governance division" with internal control, internal audit, ethics/compliance? Least incorporated Most positive 80% 9% More than two thirds of respondents indicate that risks identified within the organisation are attributed to managers who are responsible for each risk. Responsibilities can cover activities such as conducting risk workshops, implementing action plans for risk mitigation, designing more robust internal control processes… Conversely, 21% of risks are not attributed to risk owners. This significantly limits the chances of mitigation and increases the company’s exposure to those risks. Results also indicate that among the companies studied, 46% do not present a Risk Management function incorporated into a “corporate governance division”. Risk Management is handled independently from other functions such as Internal Control, Internal Audit or Ethics/Compliance. 27% of the respondents indicate that Risk Management is partially incorporated with some of these functions. * Multiple choice question October 2012
1. Risk Management fundamentals a. Impacts of the regulatory environment (6/6) Impacts of the EU 8th Directive: zoom by country (4/4) % of answers October 2012
1. Risk Management fundamentals b. Stakeholders’ expectations * (1/4) Risk Management objectives for companies’ Top Management: traditional expectations still on the top of the list but better linked with strategic decisions Align risk appetite and strategy: zoom per country Risk Management objectives remain unchanged compared to 2010 with a strong focus on risk identification and management to limit impact on operations. Traditional objectives remain on the top of the list: provide a reasonable assurance that major risks are identified, prioritised, managed and monitored (76%) and minimise operational surprises and losses (63%). The link between Risk Management and strategic decisions integrates the Top 3 replies in the 2012 results (5th in 2010). This trend is widely shared among European countries, especially in Benelux (45%) but less observed in France (23%). Finally respondents are less focused on providing integrated responses for interdependent risks in 2012 (17%) compared to 2010 (37%). * Multiple choice question October 2012
1. Risk Management fundamentals b. Stakeholders’ expectations * (2/4) Risk Management objectives for companies’ Board/Audit Committee: traditional expectations still on the top of the list but better linked with strategic decisions Align risk appetite and strategy: zoom per country Companies’ Board/Audit Committee maintain conservative objectives with respect to Risk Management. Traditional objectives remain on the top of the list: provide a reasonable assurance that major risks are identified, prioritised, managed and monitored (66%) and minimise operational surprises and losses (41%). 31% of the respondents consider that the link between Risk Management and strategic decisions is a main objective for their Board/Audit Committee. This trend is widely shared among European countries, especially in UK and Benelux (40%) but less observed in Italy (16%) or France (23%). * Multiple choice question October 2012
1. Risk Management fundamentals b. Stakeholders’ expectations * (3/4) Top Management and Board/Audit Committee: same main objectives but different levels of perception Top Management and Board/Audit Committee have overall converging objectives but respondents perceive a stronger interest at Top Management level. Respondents perceive that Top Management and Board/Audit Committee have the same Top 3 objectives but with different levels of concern. Indeed, according to 76% of respondents, providing a reasonable assurance that major risks are identified, prioritised, managed and monitored, is the main objective of their Top Management but only 66% of respondents perceive it as primary at Board/Audit Committee level. This trend is also observed for the objective of minimising operational surprises and losses (perceived as key at Top Management level by 63% of respondents against only 41% for Board/Audit Committee level). Finally, decreasing the cost of risk appears to be perceived as a main objective at Top Management level (34%) but less at Board/Audit Committee level (22%). According to respondents, four objectives are quite similar for Top Management and Board/Audit Committee: align risk appetite and strategy, enhance external reputation with investors and stakeholders, secure investments/acquisitions/projects, rationalise capital and improve predictability of delivering business plan. * Multiple choice question October 2012
1. Risk Management fundamentals b. Stakeholders’ expectations * (4/4) Influence of the recent financial and economic situation over Risk Management The difficult economic and financial situation led to an increased risk reporting to Executive Committees/Audit Committee and to a modification of the Risk governance or the Risk Management mandate. For 46% of the respondents, Risk Management increased its level of reporting to Executive/Audit Committees. This testifies to the rising interest of these committees in risk matters and a growing awareness of risk issues. The second consequence identified is the modification of the Risk governance or the Risk Management mandate for 34% of the respondents. The environment of uncertainty led companies to redefine their approach with respect to Risk Management. * Multiple choice question October 2012
1. Risk Management fundamentals c. Risk Management organisation Relationships between Risk Management, Insurance Management, Internal Control and Internal Audit Risk and Insurance Management: a close relationship. Survey results indicate that one type of organisation tends to be more commonly used than others among European companies: Risk and Insurance Management together and separated from Internal Control and from Internal Audit (39% of respondents). The second type of organisation arising from the survey consists in the four functions separated in four different departments (22% of respondents). As highlights in section 2 ‘Maturity of Risk Management practices – Risk Management functions alignment’, advanced maturity practices can only be reached through a close coordination between risk functions. October 2012
1. Risk Management fundamentals d. Risk Management standards * Risk Management framework standards of reference: a growing but still limited Risk Management standard of reference • There is still no leading Risk Management framework standard of reference and many European companies still mainly rely on internal frameworks rather than on standards. • Several Risk Management framework standards are in use such as COSO 2 (29%), ISO 31 000 standard (25%) or FERMA/Airmic and National Risk Management Standards (21%). • As compared to 2010 survey results, ISO 31 000 standards are more widely used (25% in 2012 vs. 13% in 2010). • 37% of the respondents mainly refer to internal framework except in Benelux where COSO 2 is primarily considered as a standard. • 23% of the respondents do not have any framework of reference, especially in Germany (38%). * Multiple choice question October 2012
Objectives • Assess maturity level of Risk Management practices within European companies and compare with 2010 maturity level • Illustrate maturity level of Risk Management practices regarding four main risk topics: • Risk governance • Risk practices and tools • Risk reporting and communication • Risk Management functions alignment • Capture the diversity of Risk Management practices Methodology • Selection of 13 questions (see next slide) from the survey • Breakdown of these questions by Risk Management category: • Risk governance - 4 questions • Risk practices and tools - 3 questions • Risk reporting and communication - 3 questions • Risk Management functions alignment - 3 questions • Definition of four levels of Risk Management maturity per question (see detailed graph captions): • Emerging: low or basic level of Risk Management maturity • Moderate: intermediate level of Risk Management maturity • Mature: good level of Risk Management maturity • Advanced: high level of Risk Management maturity 2. Maturity of Risk Management practices Introduction (1/2) October 2012
Risk Management maturity: 13 questions extracted from the survey Q.1.3 Mandate of the Board/Audit and/or Risk Committee(s) Q.1.2 Link between Risk Management and Board of Directors/Supervisory Board/Audit Committee Q.1.1 To whom does the Head of Risk Management report? Q.1.11 Is internal audit department providing independent assurance on overall Risk Management system? Q.2.5 To what extent does the company map its risks? Q.2.6 Approach used to measure/quantify the risks? Q.2.8 Is risk analysis formally and systematically linked to decision making? Q.1.6 Definition or communication of a formal Risk Management policy or charter Q.1.9 How is risk information currently used by the Board? Q.1.12 How does the company disclose its risks via external reporting? Q.1.10 Coordination of risk functions (Risk Management, internal audit, internal control, environment, health and safety, quality, compliance...) Q.2.2 Relationship between Risk Management and Internal Audit functions Q.2.3 To what extent does the Risk Manager cooperate with the other functions/departments? 2. Maturity of Risk Management practices Introduction (2/2) Risk governance Risk practices and tools Risk reporting and communication Risk Management functions alignment October 2012
2. Maturity of Risk Management practices Risk governance (1/5) Mandate of the Board, Audit and/or Risk Committee: a limited scope and a mandate to be clarified GRAPH CAPTION % of answers • Mandate of the Board, Audit and/or Risk Committee: • Monitor the effectiveness of the Risk Management system • Monitor and ensure the compliance of Risk Management framework with respect to standards/local regulations • Challenge the company’s risk appetite • Challenge the company’s Risk Management strategy • Challenge residual risk exposure and relevance of existing mitigation actions Most advanced Least advanced Emerging: no criteria included Moderate: 1 or 2 criteria included Mature: 3 or 4 criteria included Advanced: all criteria included Maturity • The mandate assigned to the Board, Audit and/or Risk Committee remains limited to specific areas (55%) or unclear (10%). • For 55% of the respondents, the mandate of the Board, Audit and/or Risk Committee remains limited to only one or two of the five issues highlighted in the survey. Moreover, 10% of the respondents do not have a clear vision of the mandate assigned to the Board, Audit and/or Risk Committee. • Conversely, the mandate of the Board, Audit and/or Risk Committee appears appropriate (mandate extended to 3 or more topics highlighted by the survey) for 35% of the respondents. October 2012
2. Maturity of Risk Management practices Risk governance (2/5) Risk Management interaction with "the Board": a close and regular relationship GRAPH CAPTION % of answers Most advanced Emerging Moderate Mature Advanced Least advanced No mechanism in place to ensure Risk Management interaction with the Board of Directors/Supervisory board/Audit Committee Interaction with these Committees on an as needed basis Topic of Risk Management dealt with at least on an annual basis Risk Management completely embedded in reporting to the Board Maturity • Risk Management activity is globally interacted with “the Board” (79%) and Risk Management topic is generally formally addressed by the board at least on an annual basis. • For 42% of respondents, the Risk Management topic is completely embedded in reporting to the Board. • Regarding this topic, the country of origin seems to keep a significant impact over the depth of the interaction between Risk Management and the Boards: • Countries with strong Risk Management legislation track record as UK (52% with advanced practices) and Germany (55%) benefit from better interaction levels. • The survey also highlights that in some sectors of activities such as automotive (56%) and banks/financial institutions/asset management/insurance (72%), Risk Management appears to be completely embedded in reporting to the Board. • Please note that 2012 results are in line with the 2010 survey, no significant evolution has been observed. October 2012
2. Maturity of Risk Management practices Risk governance (3/5) Risk Management reporting: increasing reporting at Top Management level GRAPH CAPTION % of answers Most advanced Emerging Moderate Mature/Advanced Least advanced Reports to other function or department Reports to CFO, General counsel/Head of Legal Department, Head of Internal Audit Reports to Audit (and/or risk) Committee, Board of Directors/Supervisory Board, CEO/Managing Director or General/Company secretary Maturity Risk Management function globally reports at Top Management level (93%), but reporting at CFO level (36%) still remains widespread among certain countries such as Italy (59%), Germany (55%) and UK (41%). This trend is not observed in France and Benelux where the Risk Management function mostly reports to CEO/Managing Director. The survey highlights that more mature reporting practices have been in place since 2010 (53% vs. 45%). The Head of Risk Management reports increasingly to Top Management. October 2012
2. Maturity of Risk Management practices Risk governance (4/5) Risk Management system independent assessment: towards a growing involvement of Internal Audit GRAPH CAPTION % of answers Most advanced Emerging Moderate/Mature Advanced Least advanced No independent assurance provided by the Internal Audit Partially independent assurance provided in collaboration with others parties Complete independent assurance provided by Internal Audit Maturity Globally, Internal Audit is increasingly involved in the process of providing an independent assurance on the quality/efficiency of the Risk Management system but its role could be strengthened. Internal Audit is fully or partially involved in the Risk Management system assessment for 78% of the respondents, which shows a clear increase compared to 2010 (61%). Listed companies present an overall stronger assurance independence of internal audit department over Risk Management system than non-listed companies (75% vs. 68%). This highlights the fact that the EU 8th Directive strengthens the role of internal audit and provides more independent assurance on the Risk Management system. October 2012
2. Maturity of Risk Management practices Risk governance (5/5) Advanced practices: zoom by country % of answers October 2012
2. Maturity of Risk Management practices Risk practices and tools (1/4) Risk mapping exercise: a standard within European companies GRAPH CAPTION % of answers Emerging Moderate Mature Advanced Most advanced Least advanced No risk mapping approach in place yet Partial approach in place (certain business units/areas, risks…) Approach in place at global corporate level (strategic, financial and operational) Approach in place from corporate level down to divisions and business units Maturity Risk mapping exercise is now considered as a Risk Management standard within European companies. 79% of the companies perform a risk mapping exercise at global (62%) or corporate (17%) levels. The exercise is more widely performed from corporate level down to divisions and business units in listed companies (64%) rather than in not listed companies (58%). October 2012
2. Maturity of Risk Management practices Risk practices and tools (2/4) Risks assessment and quantification: basic assessment methodology in place but advanced quantification tools still poorly used (1/2) % of answers GRAPH CAPTION Most advanced • The main risk measurement approaches are: • Risk assessment workshops • Internal or external databases (incident, losses…) • Value at risk simulation models (Monte Carlo, others…) • Scenario simulation models • Stochastic aggregation models of B.U (business unit)/ level risks mapping • Benchmarking Emerging: use of 1 main risk measurement approach above Moderate: use of 2 main risk measurement approaches above Mature:use of 3 or 4 main risk measurement approaches above Advanced: use of 5 or 6 main risk measurement approaches above Maturity • Risk assessment workshops are now used by 60% of European companies, a slight decline compared to 2010 when 66% of the respondents reported using this approach. • This trend is followed by all industries except automotive sector which considers databases (71%) as primary tool to manage risks. • Results also reveal that only a few countries (Italy, Russia, Spain) are building their risk approach based on databases. • Benchmarking is moderately used, especially in Italy (36%), Germany (33%) and UK (33%). • Advanced quantification is still poorly used among major European countries (UK, Germany, France, Benelux): • Stochastic aggregation models of B.U - level risk mappings used by only 11% of the companies. • Value at risk simulation models used by less than 25% of the companies. • No significant variance is observed between 2010 and 2012 risk measure and quantification approaches. s October 2012
2. Maturity of Risk Management practices Risk practices and tools (3/4) Decision making process: risk analysis and major corporate decisions are not yet fully embedded GRAPH CAPTION % of answers Most advanced • Six categories of strategic decisions identified: • Major projects • Strategic planning • Investment decisions • Contracts/bids • Acquisitions/transfers decisions • Budget decisions Least advanced Emerging: risk analysis and decision making are linked for 0 or 1 criteria Moderate: risk analysis and decision making are linked for 2 or 3 criteria Mature: risk analysis and decision making are linked for 4 or 5 criteria Advanced: risk analysis and decision making are linked for the 6 criteria Maturity Major corporate decisions do not systematically include a specific risk analysis. 66% of the companies do not systematically perform a risk analysis (emerging and moderate levels) prior to major Corporate decisions. Conversely, more than a third of the studied companies (34%) perform a risk analysis prior to most of their major Corporate decisions. Risk analyses are mainly performed for majors projects (66%) and investment decisions (46%). Germany presents an advanced maturity more than 50% of respondents perform risk analyses for 5 out of the 6 categories of strategic decisions presented above. October 2012
2. Maturity of Risk Management practices Risk practices and tools (4/4) Advanced practices: zoom by country % of answers October 2012
2. Maturity of Risk Management practices Risk reporting and communication (1/4) Risk Management role and activities: a clear definition through Risk Management policies or charters GRAPH CAPTION % of answers Emerging Moderate/Mature Advanced Most advanced Least advanced No Risk Management policy or charter has been defined A Risk Management policy is currently being prepared A formal Risk Management policy or charter has been defined and communicated Maturity Has yourcompany or group defined and communicated a formal Risk Management policy or charter? The role of Risk Management is now clearly defined, or in the process of being defined in most of the European companies. 78% of the respondents have defined (59%) or are currently in the process of defining (19%) a Risk Management policy or charter. This practice is now widespread among both listed and not listed companies and no significant variation can be observed since 2010 (from 62% in 2010 to 59% in 2012). Results demonstrate that the bigger the company, the more formal Risk Management documentation (73% for companies with more than 50,000 employees vs. 39% for those with less than 500 employees). More than 75% of respondents from Finland, Germany, Russia, Sweden and Switzerland have a defined and communicated Risk Management documentation. % of answers October 2012
2. Maturity of Risk Management practices Risk reporting and communication (2/4) Board use and perception of risk information: towards an embedded mechanism GRAPH CAPTION % of answers Most advanced Emerging Moderate Mature Advanced Least advanced No mechanism in place to ensure risk information review by the Board Risk Management topic dealt with on an as-needed basis The reported risk information is considered at least on an annual basis Complete embedding of Risk Management in decision making at Board level Maturity Boards have a regular use and a growing interest for risk information. Risk Management is now completely embedded in board decision making (31%) or the topic of Risk Management dealt at least on an annual basis (44%) In Germany, Risk Management is completely embedded in decision-making at the Board at 55% (vs 10% in France and 16% in Italy) Moreover, risk information can also be asked on an as needed basis for 18% of the respondents. Conversely, for 7% of the respondents, the Board does not perform any detailed review of the Risk Management information. Zoom country – Advanced practices % of answers October 2012
2. Maturity of Risk Management practices Risk reporting and communication (3/4) External risk communication: room for the development of a systematic communication GRAPH CAPTION % of answers Emerging Moderate/Mature Advanced Communication is minimal or only carried out on general or generic risks of the sector Communication carried out on major specific risks faced by companies, but does not disclose detailed information Communication provided for major specific risks as well as assessment of their importance and management Most advanced Least advanced Maturity Risk external reporting remains very diverse from one company to another and encompasses a large array of practices. 64% of the companies (moderate/mature and advanced practices) communicate at least about major specific risks faced by the companies, whereas 36%, still deal with a very limited level of external communication, if not minimal or inexistent communication. Risk communication tends to be more integrated with external reporting, as the 2010 survey results disclosed that 50% of companies were carrying out minimal communication or only on general or generic risks of the sector whereas this amount is only 36% in 2012. October 2012
2. Maturity of Risk Management practices Risk reporting and communication(4/4) Advanced practices: zoom by country % of answers October 2012
2. Maturity of Risk Management practices Risk Management functions alignment (1/4) Coordination between risk functions: basic coordination in place but still incomplete GRAPH CAPTION % of answers Most advanced Emerging Moderate/Mature Advanced Least advanced Risk functions(risk management, internal audit, internal control, environment, health and safety,quality, compliance…)are working independently Some coordination exists between the different risk functions Full risk functions coordination in place Maturity The different risk functions are no longer working “in silos”, however their level of coordination remains limited. A minimum level of coordination of the different risk functions is now largely widespread (64%). However, if the different risk functions do not work “in silos” any more (only 13%), a full coordination of the different risk functions appears more as a best practice (22%) than a “usual standard”. This trend is observed among all industries and is not correlated with the size of the company. October 2012
2. Maturity of Risk Management practices Risk Management functions alignment (2/4) Risk Management and Internal Audit functions: a growing relationship but still too limited synergies GRAPH CAPTION % of answers Most advanced Emerging Moderate Mature Advanced Least advanced No particular relationship between Risk Management and Internal Audit functions and/or separate reporting lines Mutual reporting – coordination/ cooperation on a limited basis Coordination and cooperation on the audit plan Very close relationship between the two functions Maturity A minimum level of coordination between the two functions is now in place for most of the European companies. A minimum level of coordination between Risk Management and Internal Audit functions is now in place for 59% of the respondents. However, there is still no particular relationship between the two functions for more than a third of the respondents (41%) which remains quite high. October 2012
2. Maturity of Risk Management practices Risk Management functions alignment (3/4) Relations between Risk Management and other functions: coordinated but not integrated (1/2) GRAPH CAPTION % of answers % of answers Mature and Advanced Integration Most advanced Least advanced Emerging/Moderate Mature Advanced No or limited integration of Risk Management with other functions Risk Management is closely cooperating with other functions Very close integration of Risk Management with other functions Maturity Risk Management works closely with other departments but integration is not systematic. Only 18% of the respondents consider there is a very close integration of Risk Management with other functions but overall Risk Management is closely cooperating with other functions (59%). Satisfactory levels of interactions are observed functions such as Ethics/Compliance, Treasury/Finance, Internal Audit/Internal Control, Business Continuity, Legal, Insurance Management with more than 50% of respondents having mature and advanced integration criteria. Risk Management is closely integrated with Insurance Management (61%) whereas has low level of relationship with departments such as Investor Relations, Sustainable development and Merger & Acquisitions (see next slide). October 2012
2. Maturity of Risk Management practices Risk Management functions alignment (3/4) Relations between Risk Management and other functions: coordinated but not integrated (2/2) Insurance Management Risk Managementfunctions Legal Internal Control/ Internal Audit Business Continuity Risk Management first-rank partners Close (3) or very close (4) relationship > 60% Risk Management second-rank partners Emerging (2) relationship >30% Risk Management third-rank partners No relationship (1) > 20% October 2012
2. Maturity of Risk Management practices Risk Management functions alignment (4/4) Advanced practices: zoom by country % of answers October 2012
2. Maturity of Risk Management practices Synthesis: results by category and level of maturity October 2012
Objectives • Classify risk importance and define risk appetite for 25 generic risks • Identify Top 5 risks Methodology • The respondents were required to classify risk importance and define risk appetite for 25 generic risk areas identified in the five most important areas of their organisation: • Strategic and corporate governance • Financial risks • External risks • Operational risks • Compliance and ethics • Based on their responses, companies were then classified into four risk appetite categories: • Risk taker zone/High impact risks • Risk taker zone/Low impact risks • No tolerance zone/High impact risks • No tolerance zone/Low impact risks 3. Riskpriorities and riskappetite triggers Introduction October 2012
3. Riskpriorities and riskappetite triggers Risk priorities What are the main risks perceived by the respondents? • Comparing the risk importance assessment between 2010 and 2012, we note that only one change occurred in the Top 5 risks. That is the risk linked to “Production, quality, cost cutting”, ranked 4th in 2010, has been replaced by the risk linked to reputation (social media, communication) in 2012. • Results also reveal that market risks are becoming more important for respondents (15% between 2010 and 2012). • However, four risks are assessed as significantly less important: • Social, economical issues (-13%). • Production, quality, cost cutting (-8%). • Product design, safety and liability (-8%). • Compliance, legislation, policy, regulations (-8%). • Compared to 2010, risk appetite is quite similar for each risk except for the “supply chain/business continuity” risk for which risk appetite is stronger in 2012 than in 2010. Top 5 risks in 2012 October 2012
3. Riskpriorities and riskappetite triggers Risk Appetite by risk category Companies’ risk appetite relies on risk category rather than risk significance. Our analysis reveals that companies’ definition of risk appetite (e.g. “zero tolerance” stance vs. “risk taker” position) only partly depends on their assessment of the significance of each risk. In fact, a closer analysis of the results shows that the declared risk appetite is mostly triggered by the risk category, rather than the risk assessment. Consequently, it appears that companies mainly adopt risk-taking strategies when it comes to external risks (competition & market, political, market risks, M&A), or, especially for complex companies, for planning and execution decisions. Conversely, companies appear to be totally averse to risks for regulatory and safety issues (risks related to compliance, ethics, fraud, internal control, corporate governance, health and safety), treasury and reputation. Compared to 2010, risk appetite for operational seems to be stronger than that in 2012 especially for the “supply chain, business continuity” risk. (interest rate & foreign exchange, debt, cah flow…) Risk appetite October 2012