Clean Air Interstate Rule (CAIR)
230 likes | 422 Vues
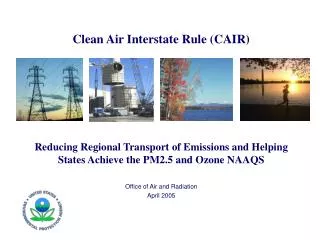
Clean Air Interstate Rule (CAIR). Reducing Power Plant Emissions for Cleaner Air, Healthier People, and a Strong America May 2005. Benefits of the Clean Air Interstate Rule (CAIR).

Clean Air Interstate Rule (CAIR)
E N D
Presentation Transcript
Clean Air Interstate Rule (CAIR) Reducing Power Plant Emissions for Cleaner Air, Healthier People, and a Strong America May 2005
Benefits of the Clean Air Interstate Rule (CAIR) • Reduces sulfur dioxide (SO2) and nitrogen oxide (NOx) emissions which contribute to fine particle pollution (PM2.5) and ground level ozone. • Provides substantial human health and environmental benefits – the largest benefits for any Clean Air Act rule in the last 12 years. • Helps cities and states in the East meet new, more stringent national ambient air quality standards for ozone and fine particles. • Emission reductions occur while economic strength is preserved. U.S. maintains both low electricity prices and fuel diversity. The most important step EPA can take now to improve air quality.
Pollutants and Concerns • Nitrogen Oxides (NOX) contribute to the formation of PM2.5 and ground-level ozone. • Sulfur Dioxide (SO2) contributes to the formation of PM2.5. • PM2.5 has been linked to premature death, serious illnesses such as chronic bronchitis and heart attacks, and respiratory problems. • Ozone causes changes in lung function and respiratory symptoms, aggravation of asthma and other respiratory conditions, and may contribute to premature mortality. • Sulfur deposition acidifies surface waters, damages forest ecosystems and soils, and contributes to decreased visibility. • Nitrogen deposition acidifies surface waters, damages forest ecosystems and soils, contributes to coastal eutrophication, and impairs visibility.
Nonattainment areas for 8-hour ozone pollution only Nonattainment areas for fine particle pollution only Nonattainment areas for both 8-hour ozone and fine particle pollution Areas Designated Nonattainment for Ozone and PM2.5 Standards – April 2005 126 ozone nonattainment areas with 474 counties 39 PM2.5 nonattainment areas with 208 counties
Long-Range Transport of Air Pollution • Air pollution can travel hundreds of miles and cause multiple health and environmental problems on regionalor national scales. • Emissions contributing to PM2.5 and ozone nonattainment often travel across state lines, especially in the eastern U.S. • SO2 and NOx, and other pollutants, contribute to PM2.5 transport • NOx and other pollutants contribute to ozone transport. • Attaining national ambient air quality standards will require some combination of emission reductions from: • Sources located in or near nonattainment areas (such as mobile sources) and • Sources, such as power plants, located further from the nonattainment area. • Clean Air Act contains provisions for States and EPA to address interstate pollution transport. • EPA is also addressing ozone and particle pollution from mobile sources by implementing national fuel and engine standards.
Eastern urban/rural fine particles 30 Bottom: Regional Contribution 25 Top: Urban Increment 20 15 ug/m3 10 5 0 Indy/LIVO SLC/GRBA Tulsa/WIMO Bronx/BRIG Fresno/PINN Atlanta/2 Sites Charlotte/LIGO Missoula/MONT Richmond/JARI St.Louis/3 Sites Baltimore/DOSO Birmingham/SIP Cleveland/MKGO Urban Increment Regional Contribution In the East, Transport Is a Major Fraction of PM2.5 and Ozone (not shown) Top: Urban Bottom: Rural 12-month average PM2.5 mass from speciation samplers Reference: 2002 EPA Trends Report http://www.epa.gov/air/airtrends/chem_spec_of_pm2.5_b.pdf
Electric Power Generation: A Major Source of Emissions SO2 Emissions NOx Emissions 10.9 Million Tons Power Sector 4.5 Million Tons 69% 5.0 Million Tons 16.3 Million Tons Other 31% Total: 20.8 Million Tons Total: 15.9 Million Tons Source: SO2 and NOx data is from EPA’s 2003 National Emissions Inventory. “Other” sources of pollutants include transportation and other mobile sources and industrial sources.
Coal Fired Power Plants in the U.S. • About 1,100 coal-fired generation units (~ 500 coal-fired power plants), representing about 305 GW of generation capacity • Existing Controls: • Almost all units have particulate matter (PM) control devices • About one-third of capacity has SO2 scrubbers • Most have initial NOx controls (low-NOx burners) • About one-third of the capacity (primarily in the east) will have advanced NOx control (SCR) when NOx SIP call is fully implemented
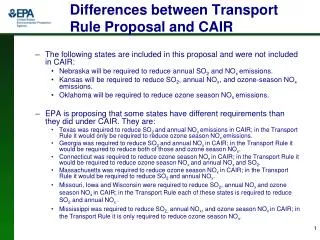
Two Ways to Address Transported Emissions from Power Plants • The President’s Clear Skies legislation is the preferred approach to achieving multipollutant emission reductions: • Multipollution caps apply to entire country. • Legislation can provide more certainty and less complexity. • Use of existing Clean Air Act authority to address interstate transport of pollution: • Until legislation passes, our attainment deadlines and other problems related to power plant emissions demand we act now. • CAIR will provide very significant air quality attainment, health, and environmental improvements across the eastern U.S. in a highly cost-effective manner.
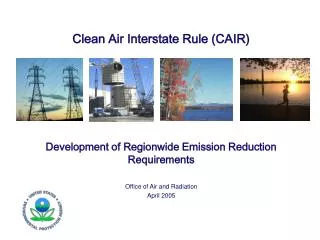
The CAIR Approach • Analyze sources of SO2 (for PM2.5) and NOx (for PM2.5 and ozone). • Determine if a significant contribution is projected from individual states on ozone and PM nonattainment in 2010, to define geographic boundaries covered by the rule. • Allow cost-effective approach for regional reductions, propose an optional cap-and-trade program similar to current Acid Rain Program for SO2 (Title IV) and the NOx SIP call. • EPA develops an emissions budget for each state based on application of highly effective controls on electric generating units (EGU) in a cap and trade program, that includes all affected states. States have discretion in deciding which sources to control to meet the budget. • Provide the most timely reductions; propose a two-phase program with declining compliance caps for NOx in 2009 and 2015, and for SO2 in 2010 and 2015.
How EPA Evaluated Significant Air Quality Contributions Simulated elimination of all anthropogenic SO2 and NOx emissions from Ohio illustrates influence of interstate transport (proposal model example) • Steps in determining significant transport • Forecast areas that would remain nonattainment in 2010 without additional controls • Zero out upwind states emissions • Determine contribution to downwind non-attainment • If >0.2 ug/m3, significant Ohio’s maximum impact on 2010 non-attainment is 1.67 ug/m3 in Pittsburgh
States controlled for fine particles (annual SO2 and NOx) States controlled for ozone (ozone season NOx) States controlled for both fine particles (annual SO2 and NOx) and ozone (ozone season NOx) States not covered by CAIR CAIR: Affected Region and Emission Caps Emission Caps* (million tons) 2009/20102015 Annual SO2 3.6 2.5 (2010) Annual NOx 1.5 1.3 (2009) Seasonal NOx .58 .48 (2009) *For the affected region.
Key Elements of CAIR • CAIR sets an emission reduction requirement for each State, based on capping power plant emissions collectively at levels that EPA believes are highly cost-effective to achieve. • Provides an optional cap and trade program based on successful Acid Rain and NOx Budget Trading programs as a method to implement the necessary reductions. • Includes a two-phase program with declining power plant emission caps: • SO2 annual caps: 3.6 million tons in 2010 and 2.5 million in 2015 • NOx annual caps: 1.5 million tons in 2009 and 1.3 million in 2015 • NOx ozone season caps: 580,000 tons in 2009 and 480,000 tons in 2015 • Emission caps are divided into State SO2 and NOx budgets. • Allows States flexibility on how to achieve the required reductions, including which sources to control and whether to join the trading program.
Cap and Trade Mechanism: Allowance Allocation and Markets • Set state budgets • Establish trading program • and market procedures • Administer tracking systems • Define allowance allocation • parameters • Identify sources for reduction • Voluntary trading program • - Adopt rules/program in 18 months • - Determine trading program budget • - Allocate NOx allowances • (SO2 already allocated) STATE ROLE EPA ROLE • EPA expects a smooth transition to new trading program • Designed with existing cap and trade programs in mind • Reasonable control costs available • High number of sources facing different control costs
CAIR Health and Environmental Benefits: Benefits over 25 Times Greater than Costs By 2015, CAIR will result in: $85-100 billion in health benefits each year, preventing: 17,000 premature deaths 22,000 non-fatal heart attacks 12,300 hospital admissions 1.7 million lost work days 500,000 lost school days. Almost $2 billion in improved visibility benefits each year. Other non-monetizable benefits – reductions of mercury emissions, acid rain, nitrification, eutrophication, and more. In 2015, CAIR will cost about $3.6 billion a year. Implementation beyond 2015 leads to higher annual benefits and costs.
10 8 6 Million Tons 4 2 0 Clean Air Heavy-Duty Diesel Tier II Vehicle Non-Road Diesel NOx SIP Call Nonroad Large Interstate Rule Emissions (Final Emissions (Final (Final Rule 5/04) (Final Rule 10/98) Spark-Ignition (from 2003 Rule 12/00) Rule 12/99) Engines, and emission levels)* Recreational Engines (Final Rule 9/02) SO2 NOx CAIR and Other Major Air Pollution Rules Since 1990: Annual Emission Reductions at Full Implementation *These reductions are calculated from 2003 levels and do not reflect the full phase in of the acid rain program. Full implementation for mobile source rules is 2030. Full implementation for the CAIR is between 2020 and 2025.
Ozone and Particle Pollution: CAIR, together with other Clean Air Programs, Will Bring Cleaner Air to Areas in the East - 2010 Nonattainment areas for 8-hour ozone pollution only Nonattainment areas for fine particle pollution only . Nonattainment areas for both 8-hour ozone and fine particle pollution Ozone and Fine Particle Nonattainment Areas (April 2005) Projected Nonattainment Areas in 2010 after Reductions from CAIR and Existing Clean Air Act Programs 104 ozone nonattainment areas (408counties) 36 PM2.5 nonattainment areas with 195 counties 14 ozone nonattainment areas 19 PM2.5 nonattainment areas Projections concerning future levels of air pollution in specific geographic locations were estimated using the best scientific models available. They are estimations, however, and should be characterized as such in any description. Actual results may vary significantly if any of the factors that influence air quality differ from the assumed values used in the projections shown here.
Ozone and Particle Pollution: CAIR, together with other Clean Air Programs, Will Bring Cleaner Air to Areas in the East - 2015 Nonattainment areas for 8-hour ozone pollution only Nonattainment areas for fine particle pollution only Nonattainment areas for both 8-hour ozone and fine particle pollution Ozone and Fine Particle Nonattainment Areas (April 2005) Projected Nonattainment Areas in 2015 after Reductions from CAIR and Existing Clean Air Act Programs 104 ozone nonattainment areas (408counties) 36 PM2.5 nonattainment areas with 195 counties 5 ozone nonattainment areas 14 PM2.5 nonattainment areas Projections concerning future levels of air pollution in specific geographic locations were estimated using the best scientific models available. They are estimations, however, and should be characterized as such in any description. Actual results may vary significantly if any of the factors that influence air quality differ from the assumed values used in the projections shown here.
Economic Growth & Environmental Improvement Power Plant SO2 Emissions (million tons) Power Plant NOx Emissions (million tons) GDP Sources: 1980 - 1999 emissions data are from the National Air Pollutant Emissions Trend Report (EPA, March 2000). Projections for SO2, NOx and mercury are derived from the Integrated Planning Model (IPM). GDP data for 1980 - 2000 is from the Bureau of Economic Analysis, U.S. Department of Commerce. The GDP projection for 2010 is from OMB’s Analytical Perspectives Report for 2003, Table 2-1. The 2010 to 2020 projection follows EIA’s assumptions in AEO 2001 of 3% growth per year.
CAIR 2003 2000 2010 2015 275 Appalachia 299 306 306 135 Interior 131 165 191 526 West 475 607 586 National 905 1,078 1,083 936 Other Projected Impacts Natural Gas Prices Regional Retail Electricity Prices $/mmBtu Note: Henry Hub prices Generation Mix Coal Production for Electricity Generation (million tons) Other 2020 Renewables 2015 2010 Hydro Nuclear Gas/Oil Coal Note: Retail prices for 2000 are from AEO2003. Natural Gas prices for 2000 are from Platts GASdat. All other data is from EPA’s Integrated Planning Model.
Summary CAIR will significantly cut emissions of SO2 and NOx from power plants and: • Helps cities and States in the East meet new, more stringent national ambient air quality standards (NAAQS) for ozone and fine particles. • Guarantees substantial benefits for public health and the environment. • Achieves the largest reduction in air pollution in more than a decade (since the highly successful Acid Rain Program). • Provides one of the largest investments in pollution control technology in history. • Serves as the single most important step to take now to improve air quality in the U.S.
To Learn More… Clean Air Interstate Rule www.epa.gov/cleanairinterstaterule