Download
1 / 23
230 likes | 348 Vues
The Clean Air Rules of 2005. Bill Wehrum U.S. EPA, Office of Air & Radiation. CAIR Health and Environmental Benefits: Benefits over 25 Times Greater than Costs. By 2015, CAIR will result in $85-100 billion in health benefits each year, preventing: 17,000 premature deaths

E N D
The Clean Air Rules of 2005 Bill Wehrum U.S. EPA, Office of Air & Radiation
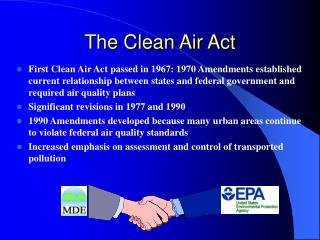
CAIR Health and Environmental Benefits: Benefits over 25 Times Greater than Costs • By 2015, CAIR will result in $85-100 billion in health benefits each year, preventing: • 17,000 premature deaths • 22,000 non-fatal heart attacks • 12,300 hospital admissions • 1.7 million lost work days • 500,000 lost school days. • Almost $2 billion in improved visibility benefits each year. • Other non-monetized benefits – reductions of mercury emissions, acid rain, nitrification, eutrophication, and more. • In 2015, CAIR will cost about $3.6 billion a year. Implementation beyond 2015 leads to higher annual benefits and costs.
10 8 6 Million Tons 4 2 0 Clean Air Heavy-Duty Diesel Tier II Vehicle Non-Road Diesel NOx SIP Call Nonroad Large Interstate Rule Emissions (Final Emissions (Final (Final Rule 5/04) (Final Rule 10/98) Spark-Ignition (from 2003 Rule 12/00) Rule 12/99) Engines, and emission levels)* Recreational Engines (Final Rule 9/02) SO2 NOx CAIR and Other Major Air Pollution Rules Since 1990: Annual Emission Reductions at Full Implementation *These reductions are calculated from 2003 levels and do not reflect the full phase in of the acid rain program. Full implementation for mobile source rules is 2030. Full implementation for the CAIR is between 2020 and 2025.
Clean Air Interstate Rule and Other Major Air Pollution Rules Since 1990: Annual Benefits Benefits of CAIR will continue to increase post-2015 2015 2030 2030 2030 2030 2004 Notes: NOx SIP Call benefits are inflated from 1990 dollars and represent the higher range of projected final rule benefits. A discount rate of 3% is used for the benefits calculation. For CAIR, an alternative 7% discount rate would yield roughly $86 billion of benefits in 2015.
CAIR and Other Major Air Pollution Rules Since 1990: Annual Private Compliance Costs at Full Implementation CAIR represents a substantial investment in cleaner air, and projected benefits are over 25 times greater than the projected costs. Notes: Annual Costs are EPA projections. NOx SIP Call costs were inflated from 1990 dollars. Full implementation for mobile source rules is 2030.
20 SO2 15 10 Million Tons NOx Projected, w/ CAIR 5 0 1980 1985 1990 1995 2000 2005 2010 2015 2020 National NOx and SO2 Power Plant Emissions:Historic and Projected with CAIR Source: EPA
25 20 15 10 5 0 Birmingham Atlanta Charlotte Baltimore Washington St.Louis Indianapolis Cleveland Richmond Bronx Urban Increment Regional Contribution In the East, Regional Emissions Contribute Significantly to Local Nonattainment Problems Urban v. Regional Contribution to PM Concentrations (2000-2002 Average, ug/m3) • Because emissions are often transported across state boundaries, both regional and local action is needed to address air quality issues. • Federal action would significantly reduce the burden on state and local governments by addressing transport.
Areas Designated Nonattainment for Ozone and PM2.5 NAAQS in 2004 Nonattainment areas for 8-hour ozone pollution only Nonattainment areas for fine particle pollution only Nonattainment areas for both 8-hour ozone and fine particle pollution 126 ozone nonattainment areas with 474 counties 47 PM2.5 nonattainment areas with 224 counties
Ozone and Particle Pollution: CAIR, together with other Clean Air Programs, Will Bring Cleaner Air to Areas in the East - 2015 Nonattainment areas for 8-hour ozone pollution only Nonattainment areas for fine particle pollution only Nonattainment areas for both 8-hour ozone and fine particle pollution Ozone and Fine Particle Nonattainment Areas (March 2005) Projected Nonattainment Areas in 2015 after Reductions from CAIR and Existing Clean Air Act Programs 104 ozone nonattainment areas with 408 counties 43 PM2.5 nonattainment areas with 211 counties 5 ozone nonattainment areas 14 PM2.5 nonattainment areas Projections concerning future levels of air pollution in specific geographic locations were estimated using the best scientific models available. They are estimations, however, and should be characterized as such in any description. Actual results may vary significantly if any of the factors that influence air quality differ from the assumed values used in the projections shown here.
Two Ways to Address Transported Emissions from Power Plants • The President’s Clear Skies legislation is the preferred approach to achieving multi-pollutant emission reductions: • Multipollution caps apply to entire country. • Legislation can provide more certainty and less complexity. • Use of existing Clean Air Act authority to address interstate transport of pollution: • Until legislation passes, our attainment deadlines and other problems related to power plant emissions demand we act now. • CAIR will provide very significant air quality attainment, health, and environmental improvements across the eastern U.S. in a highly cost-effective manner.
CAIR Implementation • The Clean Air Interstate Rule uses an approach that is similar to the NOx SIP Call but contains improvements, including: • Fewer complexities • No Flow Control • Facility Level Compliance vs. Unit Level
CAIR Delivers Considerable Environmental Benefits In 2015, annual visibility benefits would be almost $2 billion for improvements in southeastern national parks, such as Great Smoky and Shenandoah, and forests. CAIR will reduce the number of acidic lakes─ significant regional reductions in sulfur and nitrogen deposition are projected to benefit lakes and streams in the eastern U.S. • Northeast Region ─ Chronic acidity would be dramatically reduced by 2030 (only 1% of lakes would remain chronically acidic).* • Adirondack Mountains ─ Eliminates chronic acidity from lakes in the Adirondacks* Southeast Region ─ Slows the rate of stream acidification. Reductions in nitrogen deposition will benefit sensitive coastal ecosystems. 21% 12% 0 % • *Note: The figure presents results for chronic acidity only in modeled lakes. As such, model results apply to a subset of lakes in the Adirondacks and cannot be generalized to all waters in that area. These results do not include lakes that experience episodic acidification, or short periods of low Acid Neutralizing Capacity or high acidity, during storms or snowmelt. A significant proportion of Adirondack lakes could still experience episodic acidification at levels potentially harmful to fish and other aquatic species.
Deciview Change 1996 vs. 2020 with Clear Skies Deciview Change 2020 Base Case vs. Clear Skies Deciview Change (On this map, a positive change in deciview is an improvement in visibility; an negative change in deciview is a decrease in visibility.) Visibility (2020) • Under Clear Skies visibility in a large portion of the East and Midwest would improve 2-3 deciviews from current levels • visibility along the southern Appalachian Mountains would improve more than 3 deciviews • Clear Skies would improve visibility in the East and Midwest 1-2 deciviews beyond what is expected under existing programs • Under Clear Skies the WRAP agreement will be honored and the emissions reductions are expected to take effect • allow future growth in the West to occur without degrading visibility
220 tons 195 tons 120 tons Mercury Emissions Have Dropped 45% Since 1990 Source: EPA 1990, 1996 NTI and EPA 1999 NEI. Short tons per year. Adjusted for gold mines in 1990 and 1996.*The 1990 and 1996 NEI did not include gold mining emissions data. The emissions shown here for gold mines in those years are assumed to be equal to emissions for those mines in 1999.
Average Mercury Concentrations for Top 24 Types of Fish Consumed in U.S. Commercial Seafood Market * *Includes both canned light and albacore tuna Source: Carrington and Bolger, 2002 cited in NESCAUM briefing to EPA
Mercury Emissions Are a Global Problem 1999 Global Mercury Emissions Source: Based on Pacyna, J., Munthe J., Presentation at Workshop on Mercury, Brussels, March 29-30, 2004
U.S. Mercury Deposition from U.S. Utilities Total Mercury Depositionin the U.S. Mercury Deposition in the U.S. 144.23 Tons of Mercury Tons of Mercury = 2001total deposition in the U.S. from all sources, domestic and global 2001 deposition from U.S. utilities 2020 deposition from U.S. utilities after CAIR, Clean Air Mercury Rule & other Clean Air Act programs = 2001 deposition in the U.S. from U.S. utilities Source: U.S. EPA 2005
Coal Fired Power Plants in the U.S. • About 1,300 coal-fired generation units (~ 500 coal-fired power plants), representing about 305 GW of generation capacity • Existing Controls: • Almost all units have particulate matter (PM) control devices • About one-third of capacity has SO2 scrubbers • Most have initial NOx controls (low-NOx burners) • About one-third of the capacity (primarily in the east) will have advanced NOx control (SCR) when NOx SIP call is fully implemented
Mercury Capture in Existing Equipment Removal in PM Controls • Hg can be adsorbed onto unburned carbon surfaces, and captured in cold-side ESPs or FFs Capture in Wet Scrubbers • Hg(II) capture depends on solubility of each compound; Hg(0) is insoluble and cannot be easily captured • Capture enhanced by upstream SCR for bituminous coal-fired boilers
Increase the amount of Hg(II) in flue gas Oxidizing Catalysts Wet Scrubber Stack SCR PM Control Coal & Air Ash Oxidizing Chemicals Residue Enhancing Hg Removal in Wet Scrubbers • SCR – ongoing full-scale measurements: ~85- 90+% Hg removal for SCR + PM control + wet scrubber with bituminous coals; performance with low-rank coals uncertain. Effects of catalyst volume and aging and optimization of SCR for Hg captureneed investigation. • Oxidizing catalysts and chemicals – under development • FGD chemical additive – tests have been conducted at 3 sites; • limestone forced oxidation (LSFO) scrubber - successful in suppressing Hg re-emission, which results from part of the Hg absorbed in the scrubber solution getting converted to the insoluble Hg(0). • magnesium-enhanced lime scrubber – not successful in suppressing Hg re-emission. • LSFO with SCR – without SCR, additive was successful in suppressing Hg re-emission (Hg removal in scrubber improved from 70% to 78%); there was no need for additive with SCR, in which case more than 90% of Hg was removed in the scrubber.
Sorbent Injection sorbent injection coal fly ash + sorbent sorbent injection COHPAC™ ESP ESP fly ash (99%) fly ash(1%) + sorbent Option1 • Sorbent is injected upstream of the PM control device (ESP or FF) • Collected fly ash and sorbent are mixed Option 2: Electric Power Research Institute’s (EPRI) TOXECON™ System • Sorbent injection + Compact Hybrid Particulate Collector (COHPACTM) • Potential solution to ash reuse problems coal • The extent of capture depends on: • Sorbent characteristics (particle size distribution, porosity, capacity at different gas temperatures) • Residence time in the flue gas • Type of PM control (FF vs. ESP) • Concentrations of SO3 and other contaminants
Activated Carbon Injection (ACI) Activated carbon storage and feed system • ACI has successfully been used to reduce mercury emissions from waste combustors. Efforts are underway to transfer to coal-fired power plants. • ACI is currently only being used in demonstration projects. Activated carbon injection system