Download
1 / 58
580 likes | 813 Vues
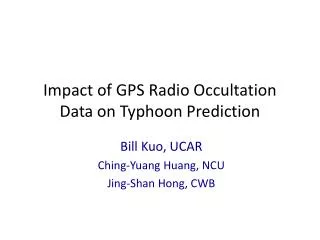
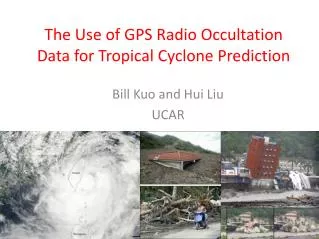
The Use of GPS Radio Occultation Data for Tropical Cyclone Prediction. Bill Kuo and Hui Liu UCAR. Outline. Prediction of tropical cyclones: Current forecast skills Comparison of operational model performance for 2011 The NOAA Hurricane Forecast Improvement Project

E N D
The Use of GPS Radio Occultation Data for Tropical Cyclone Prediction Bill Kuo and Hui Liu UCAR
Outline • Prediction of tropical cyclones: • Current forecast skills • Comparison of operational model performance for 2011 • The NOAA Hurricane Forecast Improvement Project • Impact of assimilation approaches on NCEP GFS hurricane forecast skills • GPS radio occultation (RO) and COSMIC • Assimilation of GPS RO data • Impact on the tropical cyclone analysis and prediction • Hurricane Ernesto (2006) • Typhoon Morakot (2009) • Outlook
Current capability of NHC Good track forecast improvements. Errors cut in half in 15 years. Skill of 48h forecast as good as 24-h forecast 10 years ago. No improvement in intensity forecast. Off by 2 categories 5-10% of the time.
Current capability of CWB in (km) Good improvement from 1994 to 1005. 24 hour forecast errors reduced by half in 10 years. However, the skill becomes somewhat stagnant after 2005. Does not keep track of intensity forecast.
2011 Preliminary NHC Verifications ECMWF and GFS did well (again). ECMWF beat consensus at longer ranges. TVCA beat FSSE. AEMI not as good as GFSI, even at 5 days. GFDL and HWRF middle of the pack. NGPS, CMC, UKMET trailed.
Summary of 2011 Results and Implications • Deterministic ECMWF (~16km) and GFS (~21 km) performed very well for 2011 (similar to that of 2010). Resolution matters. • ECMWF beat multi-model consensus at longer ranges. High resolution deterministic global forecast is very useful. • Multi-model consensus (TVCA) beat the FSU super ensemble (FSSE). • Lower-resolution GSF global ensemble (AEMI, ~63km) did not perform not as well as high-resolution deterministic GFS (~21km), even at 5 days. Again, resolution matters. • Performance of operational regional models (GFDL, 48/16/8 km, and HWRF, 27/9 km) was not as good as ECMWF and GFS global models. They are in the middle of the pack. Why didn’t regional model do better? What should they be used for? • NGPS, CMC, UKMET global models trailed the other global and regional models. Hurricane forecast skill is different from general synoptic forecast skill (e.g., 500 mb height).
NOAA Hurricane Forecast Improvement Project (HFIP) • 10-Year Goals: • Reduce average track error by 50% for day 1 through 5 • Reduce average intensity error by 50% for day 1 through 5 • Increase the probability of detection (POD) for rapid intensity change to 90% at Day 1 decreasing linearly to 60% at day 5, and decrease the false alarm ratio (FAR) for rapid intensity change to 10% for day 1 increasing linearly to 30% at day 5. The focus on rapid intensity change is the highest forecast challenge indentified by the National Hurricane Center. • Extend the lead time for hurricane forecasts out to Day 7 (with accuracy of Day 5 forecasts in 2003). • 5-Year Goals: • Reduce track and intensity forecast errors by 20%
HFIP Hurricane Research Priorities • Advancement in data assimilation (DA) technique • Technique to maximize the usefulness of observations • Identification and analyses of the sources of model error • Physics advances • Air-sea and BL processes • Microphysical/aerosol/radiation processes • Advanced model diagnostic techniques • Analyses and forecast of vortex low-order wavenumber evolution • Analyses and forecast of large-scale and hurricane environment evolution (e.g. shear/track) • Development of high resolution ensembles • Identify techniques to utilize ensemble members for improved intensity guidance
Comparison of EnKFvs 3D-Var Same GFS model at T574L64 (~21km at 25N) EnKF: T254L64 (~47km at 25N) GSI (3D-Var): T574L64 (~21km at 25N) Use the same operational observational data stream 2010 North Hemisphere tropical cyclones Hamill et al (2011) MWR
Comparison of EnKF, 3D-Var, and Hybrid Deep layer (850-200 mb) vector wind, 26 July – 17 Sep, 2010, 20N-20S. Hamill et al. (2011)
ECMWF and GFS Ensemble Forecast Comparison Comparison between ECMWF (T639L62, ~28km at 25N) and GFS/EnKF (T254L64, ~47km at 25N) ensemble prediction of tropical cyclones. ECMWF has significantly better performance over Western Pacific. The GFS/EnKF has larger errors over the Western Pacific than Eastern Pacific or Atlantic. Hamill et al. (2011)
Differences between ECMWF and GFS/EnKF for 200 mb wind, averaged from 7/26 – 9/27, 2010. From Hamill et al (2011). Larger difference over Western Pacific is noted.
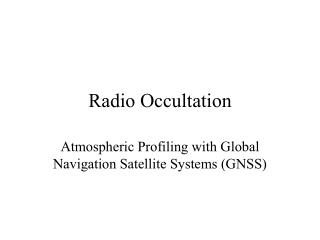
Radio Occultation Technique COSMIC – Six-Satellite constellation mission, launched in April 2006
Characteristics of GPS RO Data Limb sounding geometry complementary to ground and space nadir viewing instruments Global coverage Profiles ionosphere, stratosphere and troposphere High accuracy (equivalent to <1 K; average accuracy <0.1 K) High precision (0.02-0.05 K) High vertical resolution (0.1 km near surface – 1 km tropopause) Only system from space to observe atmospheric boundary layer All weather-minimally affected by aerosols, clouds or precipitation Independent height and pressure Requires no first guess sounding No calibration required Independent of processing center Independent of mission No instrument drift No satellite-to-satellite bias Compact sensor, low power, low cost All of these characteristics have been demonstrated in peer-reviewed literature—many were proven by COSMIC
GPS RO observations advantages for weather analysis and prediction • There are considerable uncertainties in global analyses over data void regions (e.g., where there are few or no radiosondes), despite the fact that most global analyses now make use of satellite observations. • GPS RO missions (such as COSMIC) can be designed to have globally uniform distribution (not limited by oceans, or high topography). • The accuracy of GPS RO is compatible or better than radiosonde, and can be used to calibrate other observing systems. • GPS RO observations are of high vertical resolution and high accuracy. • GPS RO is an active sensor, and provides information that other satellite observing systems could not provide • GSP RO provide valuable information on the 3D distribution of moisture over the tropics, which is important for typhoon prediction.
Problems of using GPS RO data in weather models • GPS RO data (e.g., phase, amplitude, bending angles, refractivity) are non-traditional meteorological measurements (e.g., wind, temperature, moisture, pressure), advanced assimilation systems are needed to effectively assimilate such observations. • The limb-viewing geometry makes their measurement characteristics very different from in situ point measurements (e.g., radiosonde) or the nadir-viewing passive microwave/IR measurements. Advanced observation operators are needed. • The GPS RO measurements are not perfect and subject to various sources of error (e.g., measurement noise, tracking errors, uncalibratedionospheric effects, super-refraction,…etc). • Model configuration and issues (e.g., domain size, model top, parallelization, regional/global, ionosphere, model errors) affect the choices of assimilation strategies and outcome.
Φ1, Φ2, a1, a2 Satellites orbits & Spherical symmetry α1, α2 α N T, e, P GPS RO measurements & processing Phase and amplitude of L1 and L2 Radio holographic methods, taking multipaths into account Geometrical (single ray) w/o amplitudes Bending angles of L1 and L2 Bending angle (Neutral A.) Refractivity Ionospheric correction Bending angle optimization & Abel inversion A priori meteorological data & 1D-Var
Observation type and operators Complexity of Operator Error Characteristics Neutral atmospheric Possible choices Operator is too complicated for now A Priori information is needed Error structure is too complicated to properly characterize
Current DA use of GPS RO data *Ma et al. (2011) atmospheric river study, using regional GSI + ARW. Under test
Hurrican Ernesto: Formed: 25 August 2006 Reached Hurricane strength: 27 August Dissipated: 1 September 2006 15:50 UTC 27 August 2006 Picture taken by MODIS, 250 m resolution
Forecast experiments • No GPS: initialized from AVN/GFS analysis at 2006-08-23-06Z • GPS all: assimilate all 15 GPS profiles at 2006-08-23-06Z, followed by a 5-day forecast • GPS 1 : only assimilate 1 GPS profile at 2006-08-23-06Z, followed by a 5-day forecast WRF/DART EnKF system 36-km, 32 member ensemble Use non-local excess phase observation operator
Low-level moisture change by assimilating GPS Assimilation of 1 GPS RO sounding in the vicinity of Hurricane Ernesto caused a 1.8g/kg increase in moisture at 1.5 km. This was enough to get the hurricane genesis going.
The Actual Storm NCAR 4-Day Ernesto Forecasts Forecast with GPS Forecast without GPS Y.-H. Kuo (NCAR), 2007
WRF/DART ensemble assimilation of COSMIC GPSRO soundings • WRF/DART ensemble Kalman filter data assimilation system • 36-km, 32-members, 5-day assimilation • Assimilation of 178 COSMIC GPSRO soundings (with nonlocal obs operator, Sokolovskiey et al) plus satellite cloud-drift winds • Independent verification by ~100 dropsondes. 178 COSMIC GPSRO soundings during 21-26 August 2006 From Liu et al. (2011)
Experiment Design > The first three experiments try to identify the impact of GPS data in a clean setting (without the use of any other data) > The second three experiments assess the impact of GPS RO data in a more realistic operational setting. > Conventional data includes radiosondes, surface, aircraft reports, satellite cloud track winds, no radiance.
Analysis of 850 hPa Wind and Total Column Cloud Water(06Z August 23, 36 hours before Ernesto’s genesis, GPSonly run) Where Ernesto formed at 0000 UTC 25 August Convergence and convection in Ernesto’s genesis area.
Daily Analysis Increments of Q and T (GPSonly run)(850 hPa, August 23, 2 days before Ernesto’s genesis)
2-hour Forecast Difference of GPSonly-NODA (700 hPa) Water vapor 06Z 23 August Wind 00Z 24 August 00Z 25 August Ernesto’s genesis time
Daily Analysis Increments of Wind(August 23, 2 days before Ernesto’s genesis, m/s) GPSonly run GPSonly>6km run 250 hPa 700 hPa Strong correlation between GPS in the lower troposphere and winds at all levels.
2-hour Wind Forecast Differences (250 hPa) GPSonly-FCST 06Z 23 August GPSonly>6km-FCST 00Z 24 August 00Z 25 August Ernesto’s genesis time
2-hour Forecasts RMS fit to Radiosondes and dropsondes(Averaged over tropical Atlantic, 21-26 August, 2006)
Assimilation Experiments of RO and Conventional Data • CTRL (NO GPS) run: Assimilate conventional data. • RO6km run: Add RO refractivity data only higher than 6km. • RO run: Add RO refractivity data of all levels. • Non-local RO refractivity operator is used.
Analyses of SLP and 1000 hPaVorticity(00UTC 25 August) CTRL (NOGPS) RO6km RO
48h-forecast of Track errors and SLP Intensity CTRL GPS>6km Ensemble mean of 48-hour forecasts of Ernesto’s central sea level pressure (hPa, top) and track error (km, bottom) initialized from the analyses at 0000 UTC 25 August 2006 GPS
Total Integrated Water Vapor of 48-hour Forecasts (00UTC 25 August) IR image RO CTRL 24h FCST 48h FCST
48-hour Forecasts of Ernesto (2006) with Assimilation of GPS and Conventional Observations IR Image RO RO6km 24h FCST 48h FCST Assimilation of GPS > 6km shows less positive impact
Summary of Ernesto Study • Assimilation of GPS RO data adds moisture in the lower troposphere, and produces noticeable wind increments, consistent with the convective environment. • GPS RO data in the lower troposphere is crucial for creating a favorable environment for hurricane genesis • Assimilation of GPS RO data produced improved analysis and subsequent forecasts both in terms of track and intensity.
Assimilation experiments for Morakot • Assimilation from 00Z August 3 to 18Z August 8, 2009 with 2-hourly cycling. • 36km analysis grid with 35 levels • 48h Forecast with nest grids 36km/12km/4km starting at August 7 00Z. • CWB observations are used • CTL run: Assimilate CWB conventional observations • GPS run: CTL run + COSMIC data.
Track analyses (August 3 06Z - 8 18Z) Ensemble mean Observed GPS NOGPS
SLP intensity analyses(August 3 06Z - 8 18Z) Ensemble mean Observed GPS NOGPS
24h Rain forecast (August 7 - 8 00Z) Ensemble mean Observed GPS NOGPS
48h Rain forecast (August 8 - 9 00Z) Ensemble mean Observed GPS NOGPS
Rain Probability Forecast (August 7-8 00Z) Ensemble mean Observed
Rain Probability Forecast (August 8 - 9 00Z) Ensemble mean Observed