Download

1 / 67
670 likes | 706 Vues
Explore types of experimental designs, categorical vs. continuous variables, dependent vs. independent variables, regression designs, and analysis techniques in biological research. Understand the importance of replication, randomization, and independence to avoid common pitfalls and draw accurate conclusions. Discover the nuances of variables, plotting, assumptions, and caveats in designing experiments for reliable results in ecology.

E N D
REMINDERS The goal of experimental design is to minimize the potential “sources of confusion” (Hurlbert 1984): • Temporal (and spatial) variability • Procedural effects • Experimenter bias • Experimenter-generated variability (“random error”) • Inherent variability among experimental units • Non-demonic intrusion “…it is the elementary principles of experimental design, not advanced or esoteric ones, which are most frequently and severely violated by ecologists...”
The design of an experiment The details of: • Replication • Randomization • Independence … are these always obvious in biological research? Are they system-dependent?
We cannot draw blood from a stone • Even the most sophisticated analysis CANNOT rescue a poor design!!
Categorical variables • They are classified into one or more unique categories • Sex (male, female) • Trophic status (producer, herbivore, carnivore) • Habitat type (shade, sun) • Species
Continuous variables • They are measured on a continuous numerical scale (real or integer values) • Size • Species richness • Habitat coverage • Population density NOTE: Discrete random variables such as counts are still considered continuous variables because they represent a numerical scale and not a category…
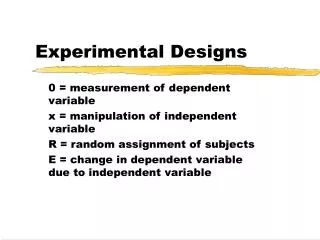
Dependent and independent variables • The assignment of dependent and independent variables implies a hypothesis of cause and effect that you are trying to test. • The dependent variable is the response variable… • The independent variable is the predictor variable…
Ordinate (vertical y-axis) Abscissa (horizontal x-axis) By convention independent variables are plotted in the x-axis and dependent variables in the y-axis… in this example we are implying that lambda (population growth) depends or is affected directly by time since fire…
The Analysis of Covariance (ANCOVA) • It is used when there are two independent variables, one of which is categorical and one of which is continuous (the covariate)
Regression designs • Single-factor regression • Multiple regression
Single-factor regression • Collect data on a set of independent replicates. • For each replicate, measure both the predictor and the response variables. • e.g. Hypothesis: seed density (the predictor variable) is responsible for rodent density (the response variable).
Plots Variables
Single-factor regression • You assume that the predictor variable is a causal variable: changes in the value of the predictor would cause a change in the value of the response. • This is very different from a study in which you would examine the correlation (statistical covariation) between two variables.
In regression (Model I) • You are assuming that the value of the independent variable is known exactly and is not subject to measurement error…
Assumptions and caveats • Adequate replication. • Independence of the data. • Ensure that the range of values sampled for the predictor variable is large enough to capture the full range of responses by the response variable. • Ensure that the distribution of predictor values is approximately uniform within the sample range.
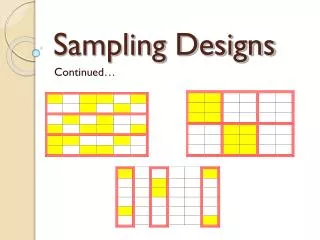
A What is different between these two designs? B Would the conclusions be different?
A What is different between these two designs? B Would the conclusions be different?
Multiple regression • Two or more continuous predictor variables are measured for each replicate, along with the single response variable…
Assumptions and caveats • Adequate replication. • Independence of the data. • Ensure that the range of values sampled for the predictor variables is large enough to capture the full range of responses by the response variable. • Ensure that the distribution of predictor values is approximately uniform within the sample range. These are the same assumptions as for the single-factor regression BUT additionally…
Multiple regression • Ideally, the different predictor variables should be independent of one another; however in reality, many predictor variables are correlated (e.g., height and weight). • This collinearity makes it difficult to estimate accurately regression parameters and to tease apart how much variation in the response variable is associated with each of the predictor variables.
Multiple regression • As always, replication becomes important as we add more predictor variables to the analysis. • In many cases it is easier to collect additional predictor variables on the same replicates than to obtain additional independent replicates. • Avoid the temptation to measure everything that you can just because it is possible. • Think about measuring variables that are meaningful for you study system!
Multiple regression • It is a mistake to think that a model selection algorithm can reliably identify the correct set of predictor variables...
ANOVA designs • Analysis of Variance • Treatments: refers to the different categories of the predictor variables. • Replicates: each of the observations made.
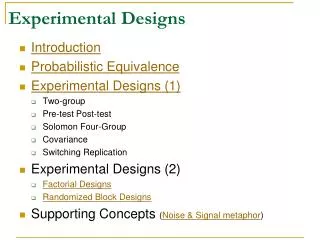
ANOVA designs • Single-factor designs • Randomized block designs • Nested designs • Multifactor designs • Split-plot designs • Repeated measurements designs • BACI designs (before-after-control-impact)
Single-factor designs • It is one of the simplest, but most powerful, experimental designs. • Can readily accommodate studies in which the number of replicates per treatment is not identical (unequal sample size).
Single-factor designs • In a single-factor design, each of the treatments represent variation in a single predictor variable or factor • Each value of the factor that represents a particular treatment is called a treatment level
Good news, bad news: • This design does not explicitly accommodate environmental heterogeneity, so we need to sample the entire array of background conditions. • This means the results can potentially be generalized across all environments, BUT… • If the background noise is much stronger than the signal of the treatments, the experiment may have low power, and therefore the analysis may not reveal treatment differences unless there are many replicates.
Randomized block designs • An effective way to incorporate environmental heterogeneity into a design. • A block is a delineated area or time period within which environmental conditions are relatively homogeneous. • Blocks can be placed randomly or systematically in the study area, but should be arranged so that the environmental conditions are more similar within blocks than between them.
Randomized block designs Valid blocking Invalid blocking
Randomized block designs • Once blocks are established, replicates will still be assigned randomly to treatments, but a single replicate from each of the treatments is assigned to each block.
Caveats • Blocks should have enough room to accommodate a single replicate of each of the treatments, and enough spacing between replicates to ensure their independence. • The blocks themselves also have to be far enough apart from each other to ensure independence of replicates among blocks.
Advantages • It can be used to control for environmental gradients and patchy habitats. • It is useful when your replication is constrained by space or time. • Can be adapted for a matched pair lay-out.
Disadvantages • If the sample size is small and the block effect weak, the randomized block design is less powerful than the simple one-way layout. • If blocks are too small, you may introduce non-independence by physically crowding the treatments together (e.g., nectar-removal and control plots on p. 152 of Gotelli & Ellison). • If any of the replicates are lost, the data from the block cannot be used unless the missing values can be estimated indirectly.
Disadvantages • It assumes that there is no interaction between the blocks and the treatments. • BUT, replication within blocks will indeed tease apart main effects, block effects, and the interaction between blocks and treatments. It will also address the problem of missing data from within a block.
Nested designs • It is any design in which there is subsampling within each of the replicates.. • In this design the subsamples are not independent of one another (if we analyze them assuming independence is it an example of pseudoreplication) • The rational of this design is to increase the precision with which we estimate the response of each replicate.
Advantages • Subsampling increases the precision of the estimate for each replicate in the design. • Allows to test two hypothesis: • First: Is there variation among treatments? • Second: Is there variation among replicates within treatments? • Can be extended to a hierarchical sampling design.
Disadvantages • They are often analyzed incorrectly! • It is difficult or even impossible to analyze properly if the sample sizes are not equal. • It often represents a case of misplaced sampling effort. Subsampling is not a solution to inadequate replication
Randomized block designs • Strictly speaking, the randomized block and the nested ANOVA are two-factor designs, but the second factor (i.e., the blocks or subsamples) is included only to control for sampling variation and is not of primary interest.
Multifactor designs • In a multifactor design, the treatments cover two (or more) different factors, and each factor is applied in combination in different treatments. • In a multifactor design, there are different levels of the treatment for each factor.
Multifactor designs • Why not just run two separate experiments? • Efficiency. It is often more cost effective to run a single experiment than to run two separate experiments. • A multifactor design allows you to test for both main effects and for interaction effects.
Multifactor designs • the main effects are the additive effects of each level of one treatment averaged over all levels of the other treatment. • the interaction effects represent unique responses to particular treatment combinations that cannot be predicted simply from knowing the main effects.
Interactions 60 50 40 West 30 North 20 10 0 1st Qtr 2nd Qtr 3rd Qtr 4th Qtr Which of these graphs are showing interactions between direction (west or north) and quarter (1st to 4th)?
Orthogonal • The key element of a proper multifactorial design is that the treatments are fully crossed or orthogonal : every treatment level of the first factor must be represented with every treatment level of the second factor and so on… • If some of the treatment combinations are missing we end with a confounded design.