Download
1 / 15
150 likes | 240 Vues
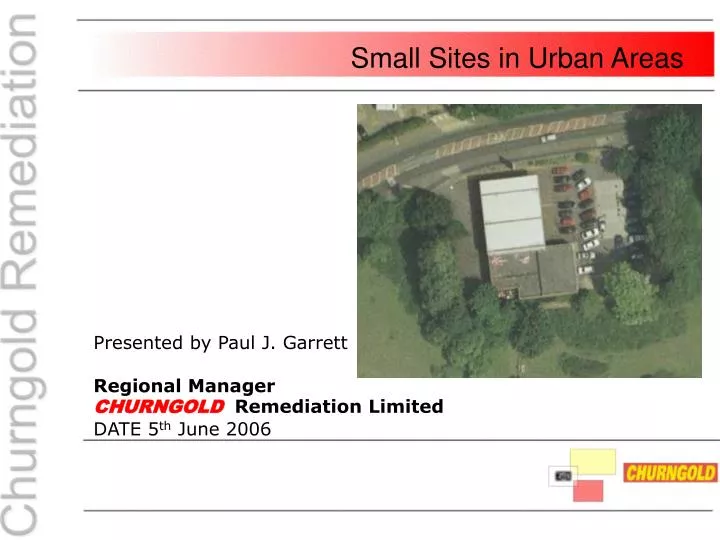
Small Sites in Urban Areas. Presented by Paul J. Garrett Regional Manager CHURNGOLD Remediation Limited DATE 5 th June 2006. Outline of Presentation. Brief summary of sites Conceptual models System designs System performance Comparisons of Cost & Performance Conclusions.

E N D
Small Sites in Urban Areas • Presented by Paul J. Garrett • Regional Manager • CHURNGOLD Remediation Limited • DATE 5th June 2006
Outline of Presentation • Brief summary of sites • Conceptual models • System designs • System performance • Comparisons of Cost & Performance • Conclusions
Site in South East England Conceptual Model • Former Petrol Filling Station (PFS) located in urban area (bordered by residential housing) • Gross petrol range contamination (inc. BTEXs) in soils and groundwater • Free Product Encountered • SSTL’s derived from QRA – effectively a 90-99% reduction required • Geology – Sands and gravels – Weathered Sandstone • Client wants quickest solution possible!
Site in South East England Proposed Treatment Solution Proposed Solution – Steam Enhanced Remediation
Programme Start of the project Day 0 End of treatment Day 193 On Site Day 55 Completion of Validation Day 277 Start of treatment Day 103
58 Days Since Commissioning: 18th April 2005 Baseline 17th February 2005 Results Performance Results taken from a similar project 5mins away from site Cumulative Mass Recovery Curve for Xylene Vapours Increasing temperatures increases treatment rates
Site in Midlands Conceptual Model • Another Petrol Filling Station (PFS) – contaminated with petrol range contamination • Geology is very similar – sands on top of weathered sandstone • Free product encountered • SSTL’s delivered from QRA – 90-95% reductions required • Client’s not concerned with timeframe
Site in Midlands Proposed Treatment Solution/Programme • Phased approach proposed • Free product skimming using vacuum enhanced pumping (3months) • Bio-venting • In-situ Bioremediation using Oxygen Infusion • Timeframe for treatment = 60 months
Performance Results below taken from project using similar technology Mass Balance Calculation
SER SYSTEM – Total cost: €353,300 (£240,000) • More complex engineering required • More expensive to run (fuel costs for boiler etc) • Needs more engineers to operate (2no. full time) and manage Health & Safety • VACUUM/BIO SYSTEM - Total cost €125,100 (£85,000) • System engineering less intensive • System has minimal power requirements • Very reliable, hence needs little operations (1 visit per month) Comparing Costs and Performance
The SER system needs complex engineering • Upfront detail design/licensing • Steam generator • High vacuum extraction system • Heat exchangers • Treatment plant (GAC filters) • Control system – (auto shutdown/temperature monitoring) 35% of total cost - €123,500 (£84,000) • The Bioventing/In-situ Bio is mostly • Down well units • Control system • Compressor system 65% of Total costs - €81,300 (£55,250) Cost & Performance Comparison – Engineering Cost
The SER system will generate “hot” waste streams • Additional monitoring to ensure Health & Safety maintained • Needs treatment (GAC consumption, discharge to sewer) • Needs initial heating (fuel consumption) 42% of total cost - €141,00 (£96,000) • The Bioventing/In-situ Bio system “after initial skimming phase” • Low power required (oxygen injected via pressurised cylinders) • No waste stream generation 6% of Total costs - €7,500 (£5,100) Cost & Performance Comparison – Running Costs
The SER system needs fulltime operation/management • During heating 2no. Engineers • During cooling 1no. Engineer • Additional project management (Health & Safety) 25% of total cost - €88,300 (£60,000) • The Bioventing/In-situ Bio system needs routine maintenance only • System looks after itself • Has little to go wrong • Is inherently safe 29% of Total costs - €36,300 (£24,650) Cost & Performance Comparison – Man Power
Conclusions • More powerful solutions such as SER will get you there quicker! • They also get you there with more certainty • More powerful solutions come with a higher running cost
NORHTERN OFFICE Cinnamon House Crab Lane Warrington WA2 0XP United Kingdom Tel: +44 1925 661 706 Fax: +44 1925 661 800 LONDON & SOUTH EAST OFFICE Network House Bradfield Close Woking Surrey GU22 7RE United Kingdom Tel: +44 1483 206 936 Fax: +44 1483 206 937 HEAD OFFICE St Andrews House St Andrews Road Avonmouth Bristol BS11 9DQ United Kingdom Tel: +44 117 916 0510 Fax: +44 117 916 0511 http://www.churngold.com E-mail: paul.garrett@churngold.com