Download
1 / 26
260 likes | 440 Vues
This overview explores the intricate factors affecting phytoplankton dynamics in San Francisco Bay, including salinity, temperature, turbidity, dissolved oxygen, and chlorophyll levels. Research indicates that phytoplankton growth is influenced by resources, light availability, and nutrient loadings. The study also highlights that the increasing phytoplankton is not directly correlated with nutrient increases, as evidenced by various hypotheses and models analyzing historical data. It emphasizes the complexity of aquatic ecosystems and the ongoing changes they face.

E N D
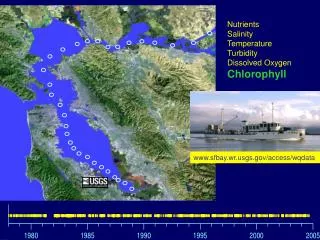
Nutrients Salinity Temperature Turbidity Dissolved Oxygen Chlorophyll www.sfbay.wr.usgs.gov/access/wqdata
North Bay South Bay
Story 1: North Bay USGS + Interagency Ecological Program
Corbula amurensis Interagency Ecological Program
Story 2: South Bay Chlorophyll a (mg/L) 1977-1998
Seasonal Kendall Test (Helsel & Hirsch 1992) % per year
Ecologically Important • NOT related to nutrient (N,P) increases
Why is phytoplankton increasing in San Francisco Bay? Four Hypotheses Resources Light Nutrients 1 4 Growth Mortality Impairments Herbicides Metals Transport 2 3
Resources Light Growth 1 Sediment Input (Mt/y) McKee et al. (2006) “sediment yield of the Sacramento River decreased by about half from 1957-2001” (Wright & Schoellhamer 2004).
Growth Impairments Metals 2 City of San Jose, Environmental Services (2006)
Upwelling Intensity Transport 3 NOAA PFEL
Speckled Sanddabs English Sole Mortality 4 California Dept. Fish & Game
Lessons • aquatic ecosystems are in perpetual state of change • unraveling the processes is particularly challenging in estuaries • water quality is influenced by connectivity to the coastal ocean and local watersheds • alien species can be as disruptive as chemical pollution • phytoplankton dynamics are influenced by more than nutrient loadings Thanks to Tara Schraga, Kate Dallas, Alan Jassby, Jan Thompson, Dave Schoellhamer, Kathy Hieb, San Jose Environmental Services, Regional Monitoring Program
Conceptual Model Resources Light Nutrients Growth Mortality Impairments Herbicides Metals Transport Nancy Monsen
Robin Stewart (USGS): Selenium concentrations in fish Striped Bass White Sturgeon 50 Mean ± SE *** 40 30 * Se conc. (µg/g) 20 10 0 1990 n=25 2000 n=15 1986 n=5 1990 n=10 1999 n=15 1986 n=10 CDFG (data 1986, 1990)
Seasonal Kendall Test for Trends (Helsel & Hirsch 1992) % per year
Not associated with nutrient increases % per year