Download
1 / 74
740 likes | 783 Vues
Explore modeling and identification of gene-protein interaction networks using piecewise linear dynamic models. Understand the implications of stochastic fluctuations and deterministic chaos. Learn about the challenges and methods for reconstruction from limited data.

E N D
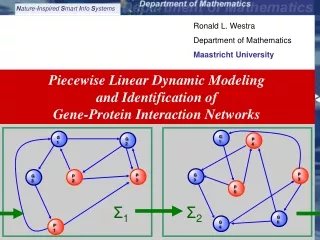
G1 P4 G1 G2 P3 G3 Σ1 Σ2 P5 G6 G4 P3 G3 P2 P1 Ronald L. Westra Department of Mathematics Maastricht University Piecewise Linear Dynamic Modeling and Identification of Gene-Protein Interaction Networks Westra: Piecewise Linear Dynamic Modeling and Identification of Gene-Protein Interaction Networks
Items in this Presentation 1. Background and problem formulation 2. Modeling the interactions between genes and proteins 3. The implications of stochastic fluctuations and deterministic chaos4. Identification of interactions between genes and proteins 5. Lessons from nature Westra: Piecewise Linear Dynamic Modeling and Identification of Gene-Protein Interaction Networks
1. Problem formulation Question: Can gene regulatory networks be reconstructed from time series of observations of (partial) genome wide and protein concentrations? Westra: Piecewise Linear Dynamic Modeling and Identification of Gene-Protein Interaction Networks
Problems in modeling and identification • Relation between mathematical model and phys-chem-biol reality • Macroscopiccomplexity from simple microscopic interactions • Approximate modeling as partitioned in subsystems with local dynamics • Modeling of subsystems as piecewise linear systems (PWL) • PWL-Identification algorithms: network reconstruction from (partial) expression and RNA/protein data • Experimental conditions of poor data: lots of gene but little data • The role of stochasticity andchaos on the identifiability Westra: Piecewise Linear Dynamic Modeling and Identification of Gene-Protein Interaction Networks
2. Modeling the Interactions between Genes and Proteins Prerequisite for the successful reconstruction of gene-protein networks is the way in which the dynamics of their interactions is modeled. Westra: Piecewise Linear Dynamic Modeling and Identification of Gene-Protein Interaction Networks
2.1 Modeling the molecular dynamics and reaction kinetics as Stochastic Differential Equations Biochemical reactions and kinematic rate equations: this is a microscopic reality: (in)elastic collisions, electrostatic forces, “binding” this is a statistic average. true only under some conditions Westra: Piecewise Linear Dynamic Modeling and Identification of Gene-Protein Interaction Networks
Conditions for modeling reactions as rate equations • The law of large numbers. In inhomogeneous mixtures or in slow reactions as in gene-, RNA-, and protein-interactions this will not (always) be true. Hence; the problem is stochastic. • The Maxwell velocity distribution should apply, otherwise details of the velocity distribution will enter. This condition is not met for macromolecules in a cytoplasm. • The distribution of the internal degrees of freedom of the constituents, like rotational and vibrational energies, must have the same ’temperature’ as the Maxwell velocity distribution, otherwise it will influence the rate of the collisions that result in a chemical reaction. This condition is not met by gene/RNA/protein interactions. Westra: Piecewise Linear Dynamic Modeling and Identification of Gene-Protein Interaction Networks
2.2 Gene-Protein Interaction Networks as Piecewise Linear Models • The general case is complex and approximate • Strongly dependent on unknown microscopic details • Relevant parameters are unidentified and thus unknown Westra: Piecewise Linear Dynamic Modeling and Identification of Gene-Protein Interaction Networks
1. Qualitative Piecewise Linear Models FollowingHidde de Jong et al. (2002, 2004) bilsum of step-functions s+,– Westra: Piecewise Linear Dynamic Modeling and Identification of Gene-Protein Interaction Networks
Qualitative Piecewise Linear Models – H. de Jong Example with kind permission from:Hidde de Jong (J.Comp.Biol.2002) Westra: Piecewise Linear Dynamic Modeling and Identification of Gene-Protein Interaction Networks
Qualitative Piecewise Linear Models – H. de Jong Example with kind permission from:Hidde de Jong (J.Comp.Biol.2002) Westra: Piecewise Linear Dynamic Modeling and Identification of Gene-Protein Interaction Networks
2. Modeling of PWL Systems as subspace models • Global dynamics: • Local attractors (uniform, cycles, strange) • Basins of Attraction • Each BoA is a subsystem Σi • “checkpoints” Σ5 Σ4 Σ1 Σ6 Σ3 Σ2 State space Westra: Piecewise Linear Dynamic Modeling and Identification of Gene-Protein Interaction Networks
Modeling of PWL Systems as subspace models • State vector moves through state space • driven by local dynamics (attractor, repeller) and inputs • in each subsystem Σ1 the dynamics is governed by the local equilibria. • approximation of subsystem as linear statespace model: State space Westra: Piecewise Linear Dynamic Modeling and Identification of Gene-Protein Interaction Networks
2.3 Problems concerning the identifiability of Piecewise Linear models 1. Due to the huge costs and efforts involved in the experiments, only a limited number of time points are available in the data. Together with the high dimensionality of the system, this makes the problem severely under-determined. 2. In the time series many genes exhibit strong correlation in their time-evolution, which is not per se indicative for a strong coupling between these genes but rather induced by the over-all dynamics of the ensemble of genes. This can be avoided by persistently exciting inputs. Westra: Piecewise Linear Dynamic Modeling and Identification of Gene-Protein Interaction Networks
2.3 Problems concerning the identifiability of Piecewise Linear models 3. Not all genes are observed in the experiment, and certainly most of the RNAs and proteins are not considered. therefore, there are many hiddenstates. 4. Effects of stochastic fluctuations on genes with low transcription factors are severe and will obscure their true dependencies. Westra: Piecewise Linear Dynamic Modeling and Identification of Gene-Protein Interaction Networks
3. The Implications of Stochastic fluctuations and Deterministic Chaos Experimental and theoretical studies now indicate that stochasticity plays a vital role in the self-organized control of biological processes. Westra: Piecewise Linear Dynamic Modeling and Identification of Gene-Protein Interaction Networks
Stochasticity appears detrimental to the process Influence of stochastic fluctuations on the evolution of the expression of two coupled genes. Westra: Piecewise Linear Dynamic Modeling and Identification of Gene-Protein Interaction Networks
3.1 Stochastic fluctuations • i. In experimental work on E. coli, Elowitzand Swainfound that low intracellular copy numbers of molecules can limit the precision of gene regulation. • They found that: • genotypic identical cells exhibit substantial phenotypic variation • this variation arises from stochasticity in gene expression • this variation is essential for many biological processes • prime factors in stochasticity are: transcription rate, regulatory dynamics, and genetic factors . Westra: Piecewise Linear Dynamic Modeling and Identification of Gene-Protein Interaction Networks
ii. In stochastic simulations on Drosophila and Neurospora, Goldbeterand Gonzefound that robust circadian oscillations can emerge at the cellular level, even when only a few tens of mRNA and protein molecules are involved. This shows how autoregulation processes at the cellular level allow the emergence of a coherent biological rhythm out of molecular noise. Westra: Piecewise Linear Dynamic Modeling and Identification of Gene-Protein Interaction Networks
3.1 Stochastic fluctuations iii. Steuer found that the addition of noise to a deterministic simulation model of the cell-cycle in fission yeast (Tyson-Novak model) could explain several experimental findings, such as the existence of quantized cycle times in double-mutant wee1−cdc25 cells. Moreover, he found that his stochastic model led to the emergence of noise induced oscillations. Westra: Piecewise Linear Dynamic Modeling and Identification of Gene-Protein Interaction Networks
The deterministic and stochastic Tyson-Novak model. Westra: Piecewise Linear Dynamic Modeling and Identification of Gene-Protein Interaction Networks
Stochastic fluctuations Nature is robust to noise and exploits noise in controlling quasi-cyclic processes by hierarchic and sparse organization: masters and slaves Different roles in different sub-systems Therefore flexible network structure Westra: Piecewise Linear Dynamic Modeling and Identification of Gene-Protein Interaction Networks
G1 P4 G1 G2 P3 G3 Σ1 Σ2 P5 G6 G4 P3 G3 P2 P1 Flexible network structure with chancing master-slaves Westra: Piecewise Linear Dynamic Modeling and Identification of Gene-Protein Interaction Networks
Example Westra: Piecewise Linear Dynamic Modeling and Identification of Gene-Protein Interaction Networks
Example Westra: Piecewise Linear Dynamic Modeling and Identification of Gene-Protein Interaction Networks
Example Westra: Piecewise Linear Dynamic Modeling and Identification of Gene-Protein Interaction Networks
Example Matlab-simulation y(1) = - 0.03*x(1) + 0.2*(1-x(1))*a(2)^2 - 0.2*x(1)*a(3) ; y(2) = - 0.05*x(2) + 0.3*(1-x(2))*a(1) - 0.1*x(2)*a(4) ; y(3) = - 0.02*x(3) + 0.1*(1-x(3))*a(2) - 0.1*x(3)*a(1) ; y(4) = - 0.01*x(4) + 0.2*(1-x(4))*a(1)*a(2) - 0.2*x(4)*a(3)^2; y(5) = - 0.02*x(5) + 0.3*(1-x(5))*a(3) - 0.1*x(5)*a(1); y(6) = - 0.02*a(1) + 0.4*x(1) - 0.2*a(1)*a(2) - 0.1*a(1)*a(3)^3; y(7) = - 0.01*a(2) + 0.15*x(2) - 0.2*a(1)*a(2); y(8) = - 0.01*a(3) + 0.2*a(1)*a(2) - 0.1*a(1)*a(3)^3; y(9) = - 0.05*a(4) + 0.9*a(1)*a(3); Westra: Piecewise Linear Dynamic Modeling and Identification of Gene-Protein Interaction Networks
Westra: Piecewise Linear Dynamic Modeling and Identification of Gene-Protein Interaction Networks
Westra: Piecewise Linear Dynamic Modeling and Identification of Gene-Protein Interaction Networks
Problems with stochastic modeling • Such are the problems relating to the identifiability of piecewise linear systems: • Are conditions for modeling rate equations met? • High stochasticity and chaos • Are piecewise linear approximations a valid metaphor? Westra: Piecewise Linear Dynamic Modeling and Identification of Gene-Protein Interaction Networks
4. Identification of Interactions between Genes and Proteins Based on the (sub) space models of piecewise linear systems. Westra: Piecewise Linear Dynamic Modeling and Identification of Gene-Protein Interaction Networks
4.1 The identification of SIMPLE linear networks by partial L1-minimization • First we study the case of K = 1, i.e. one subsystem • We assume a hierarchic, non-symmetric, and sparse system with linear state space dynamics Westra: Piecewise Linear Dynamic Modeling and Identification of Gene-Protein Interaction Networks
General subspace dynamics The evolution of the n-dimensional state space vector x (gene expressions) depend on p-dim inputs u, parameters θ and white noise ξ. Westra: Piecewise Linear Dynamic Modeling and Identification of Gene-Protein Interaction Networks
Linearized form of subsystem Σl First order linear approximation of system separates state vector x and inputs u. Westra: Piecewise Linear Dynamic Modeling and Identification of Gene-Protein Interaction Networks
Data from experiments & observations Empirical data : Hankel-matrices Westra: Piecewise Linear Dynamic Modeling and Identification of Gene-Protein Interaction Networks
Relation between Hankel matrices The relation between the state derivatives, states and inputs is also applicable to the data matrices. Westra: Piecewise Linear Dynamic Modeling and Identification of Gene-Protein Interaction Networks
Row-by-row relation Set of N decoupled linear systems of size Mx(N+m) α is sparse, β not necessarily Westra: Piecewise Linear Dynamic Modeling and Identification of Gene-Protein Interaction Networks
Reformulation: A: Hankel matrices X and U, x: rows of A and B, b: row of state derivatives Westra: Piecewise Linear Dynamic Modeling and Identification of Gene-Protein Interaction Networks
Solution to partial sparse case Primal problem Westra: Piecewise Linear Dynamic Modeling and Identification of Gene-Protein Interaction Networks
Partial sparse case – dual approach Dual problem Westra: Piecewise Linear Dynamic Modeling and Identification of Gene-Protein Interaction Networks
Performance of dual partial approach Artificially produced data reconstructed with this approach Compare reconstructed and original data Westra: Piecewise Linear Dynamic Modeling and Identification of Gene-Protein Interaction Networks
The influence of increasing intrinsic noise on the identifiability. Westra: Piecewise Linear Dynamic Modeling and Identification of Gene-Protein Interaction Networks
a: CPU-time Tc as a function of the problem size N, b: Number of errors as a function of the number of nonzero entries k, M = 150, m = 5, N = 50000. Westra: Piecewise Linear Dynamic Modeling and Identification of Gene-Protein Interaction Networks
a: Number of errors versus M, b: Computation time versus M N = 50000, k = 10, m = 0. Westra: Piecewise Linear Dynamic Modeling and Identification of Gene-Protein Interaction Networks
a: Minimal number of measurements Mmin required to compute A free of error versus the problem size N, b: Number of errors as a function of the intrinsic noise level σA N = 10000, k = 10, m = 5, M = 150, measuring noise B = 0. Westra: Piecewise Linear Dynamic Modeling and Identification of Gene-Protein Interaction Networks
4.2 The identification of PIECEWISE linear networks by L1-minimization • Second we study the general case of K > 1, i.e. multiple subsystem • Again: we assume hierarchic, non-symmetric, and sparse systems with linear state space dynamics Westra: Piecewise Linear Dynamic Modeling and Identification of Gene-Protein Interaction Networks
The identification of PIECEWISE linear networks by L1-minimization K linear time-invariant subsystems {Σ1, Σ2, .., ΣK} Continuous/Discrete time Westra: Piecewise Linear Dynamic Modeling and Identification of Gene-Protein Interaction Networks
4.2 The identification of PIECEWISE linear networks by L1-minimization Weights wkjindicate membership of observation #k to subsystemΣj : Westra: Piecewise Linear Dynamic Modeling and Identification of Gene-Protein Interaction Networks
Rich and Poor data poor data:not sufficient empirical data is available to reliably estimate all system parameters, i.e. the resulting identification problem is under-determined. Westra: Piecewise Linear Dynamic Modeling and Identification of Gene-Protein Interaction Networks
(un)known switching times, regular sampling intervals, rich / poor data, • Identification of PWL models with knownswitching times and regularsampling intervals from richdata • Identification of PWL models with knownswitching times and regularsampling intervals from poordata Westra: Piecewise Linear Dynamic Modeling and Identification of Gene-Protein Interaction Networks