Download
1 / 22
220 likes | 290 Vues
Learn the fundamentals of statistics for making better decisions in business. Covers descriptive and inferential statistics, sampling, probability, and drawing conclusions. Practical examples provided.

E N D
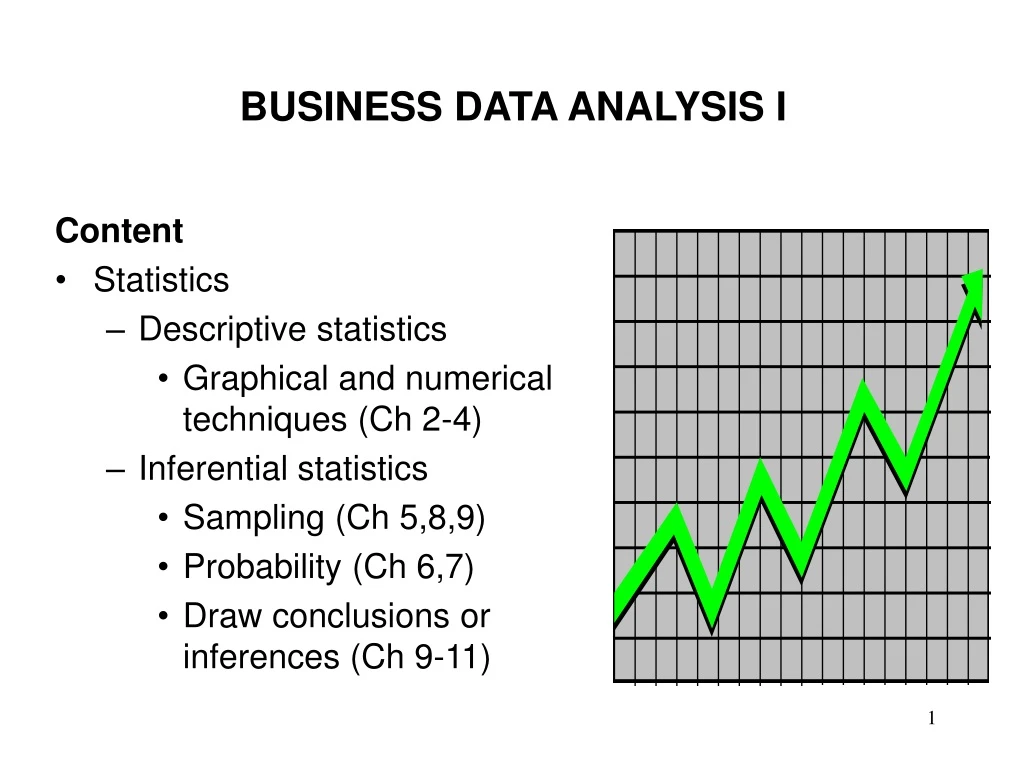
BUSINESS DATA ANALYSIS I Content • Statistics • Descriptive statistics • Graphical and numerical techniques (Ch 2-4) • Inferential statistics • Sampling (Ch 5,8,9) • Probability (Ch 6,7) • Draw conclusions or inferences (Ch 9-11)
BUSINESS DATA ANALYSIS I What is statistics • Statisticsisthe body of techniques used to facilitate the collection, organization, presentation, analysis, and interpretation of data for the purpose of making better decisions.
BUSINESS DATA ANALYSIS I Who uses statistics • Statistical techniques are used extensively by marketing, accounting, quality control, consumers, professional sports people, hospital administrators, educators, politicians, physicians, etc....
COURSE INTRODUCTION • Text • Lectures • Computer lab • Website: overheads, assignments, solutions, computer lab documents, midterm and exam information, and other announcements and information • Grading • 4 Assignments • Midterm • Final exam (comprehensive)
A WORD ABOUT CONDUCT • Basic principles 1. Every student has the right to learn as well as responsibility not to deprive others of their right to learn. 2. Every student is accountable for his or her own actions.
In order for you to get the most out of this class, please consider the following: a. Attend all scheduled classes and arrive on time. Late arrivals and early departures are very disruptive and violate the first basic principle. b. Please do not schedule other activities during this class time. I will try to make class as interesting and informative as possible, but I can’t learn the material for you. c. Please let me know immediately if you have a problem that is preventing you from performing satisfactorily in this class.
STATISTICS Statistical Methods Descriptive Inferential Statistics Statistics
DESCRIPTIVE STATISTICS • Involves • Collecting data • Organizing or summarizing data • Presenting data • Purpose • Describe data X = 30.5 S2 = 113
DESCRIPTIVE STATISTICS • EXAMPLE 1: A survey conducted by the Financial Post Magazine found that 50.08% of the people wanted to vote “no” in Quebec referendum in 1995. The statistic 50.08% describes the proportion of voters who wanted to stay in Canada. • EXAMPLE 2: According to Consumer Reports, Whirlpool washing machine owners reported 9 problems per 100 machines during 1995. The statistic 9 describes the number of problems out of every 100 machines.
DESCRIPTIVE STATISTICS • Wesbster’s New Collegiate Dictionary has the following definitions • Describe – to represent by a figure, model, or picture • Statistics – a branch of mathematics dealing with the collection, analysis, interpretation, presentation of masses of numerical data. • Descriptive statistics are the tabular, graphical, and numerical methods used to summarize data.
EXAMPLE: HUDSON AUTO REPAIR The manager of Hudson Auto would like to have a better understanding of the cost of parts used in the engine tune-ups performed in the shop. She examines 50 customer invoices for tune-ups. The costs of parts, rounded to the nearest dollar, are listed below. What would you do?
EXAMPLE: HUDSON AUTO REPAIRTABULAR & GRAPHICAL • Tabular Summary (Frequencies and Percent Frequencies Parts Percent Cost ($)FrequencyFrequency 50-59 2 4 60-69 13 26 70-79 16 32 80-89 7 14 90-99 7 14 100-109 510 Total 50 100
EXAMPLE: HUDSON AUTO REPAIRTABULAR & GRAPHICAL 18 • Graphical Summary (Histogram) 16 14 12 Frequency 10 8 6 4 2 Parts Cost ($) 50 60 70 80 90 100
EXAMPLE: HUDSON AUTO REPAIRNUMERICAL • Numerical Descriptive Statistics • The most common numerical descriptive statistic is the average (or mean). • Hudson’s average cost of parts, based on the 50 tune-ups studied, is $79 (found by summing the 50 cost values and then dividing by 50).
STATISTICS Statistical Methods Descriptive Inferential Statistics Statistics
INFERENTIAL STATISTICS Population? • Involves • Estimation • Hypothesis testing • Purpose • Draw conclusions or inferences about population characteristics
INFERENTIAL STATISTICS • EXAMPLE 1: TV networks constantly monitor the popularity of their programs and sample the preferences of TV viewers. • EXAMPLE 2: The accounting department of a large firm will select a sample of the invoices to check for accuracy for all the invoices of the company. • EXAMPLE 3: Wine tasters sip a few drops of wine to make a decision with respect to all the wine waiting to be released for sale.
KEY TERMS • Population (universe) • The set of all items of interest • The word population does not necessarily refer to a group of people. • In case of Hudson Auto population refer to the set of all engine tune-ups. • Sample • A set of data drawn (or observed) from the population • In case of Hudson Auto sample refers to the set of 50 tune-ups examined
KEY TERMS • Parameter • Summary measure about population • Usually unknown or known from some published sources • In case of Hudson Auto a parameter is the average cost of parts used in all engine tune-ups. • Statistic • Summary measure about sample • Obtained from the sample • In case of Hudson Auto a statistic is the average cost, $79 of parts used in 50 engine tune-ups examined.
STATISTICAL INFERENCE • Webster’s New Collegiate Dictionary • Infer – to derive as a conclusion from facts of premises. • Inference – the act of passing from statistical sample data to generalizations. • Statistics – a branch of mathematics dealing with the collection, analysis, interpretation, presentation of masses of numerical data. • Statistical inference is the process of using data obtained from a small group of elements (the sample) to make estimates and test hypotheses about the characteristics of a larger group of elements (the population).
EXAMPLE: HUDSON AUTO REPAIR 1. Population consists of all tune-ups. Average cost of parts is unknown. • Process of Statistical Inference 2. A sample of 50 engine tune-ups is examined. 3. The sample data provide a sample average cost of $79 per tune-up. 4. The value of the sample average is used to make an estimate of the population average.