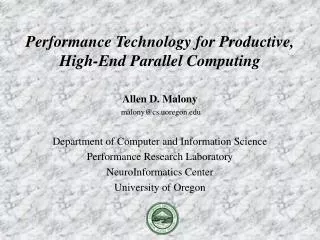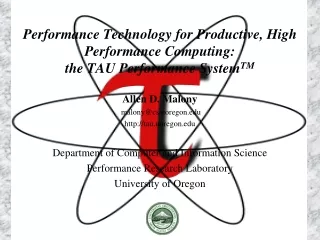
Performance Technology for Productive, High-End Parallel Computing
This talk explores performance problem-solving, scalability, productivity, and advances in performance technology for high-end parallel computing. It covers tools like TAU parallel performance system, performance data management, and data mining. The talk also discusses future work and concluding remarks.

Performance Technology for Productive, High-End Parallel Computing
E N D
Presentation Transcript
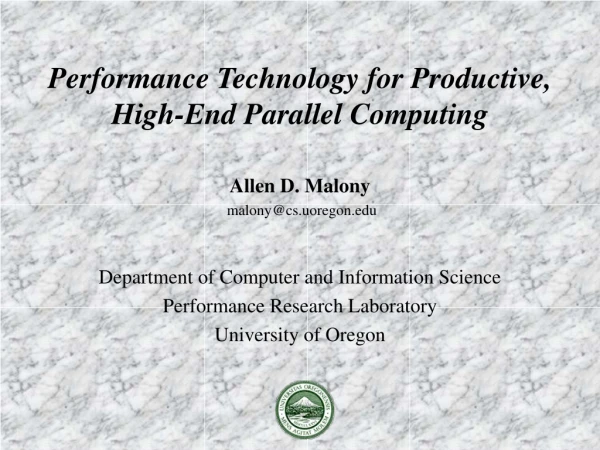
Performance Technology for Productive,High-End Parallel Computing Allen D. Malony malony@cs.uoregon.edu Department of Computer and Information Science Performance Research Laboratory University of Oregon
Outline of Talk • Performance problem solving • Scalability, productivity, and performance technology • Application-specific and autonomic performance tools • TAU parallel performance system and advances • Performance data management and data mining • Performance Data Management Framework (PerfDMF) • PerfExplorer • Multi-experiment case studies • Comparative analysis (PERC tool study) • Clustering analysis • Future work and concluding remarks
PerformanceTuning PerformanceTechnology hypotheses Performance Diagnosis • Experimentmanagement • Performancestorage PerformanceTechnology properties Performance Experimentation • Instrumentation • Measurement • Analysis • Visualization characterization Performance Observation Research Motivation • Tools for performance problem solving • Empirical-based performance optimization process • Performance technology concerns
Challenges in Performance Problem Solving • How to make the process more effective (productive)? • Process may depend on scale of parallel system • What are the important events and performance metrics? • Tied to application structure and computational model • Tied to application domain and algorithms • Process and tools can/must be more application-aware • Tools have poor support for application-specific aspects • What are the significant issues that will affect the technology used to support the process? • Enhance application development and benchmarking • New paradigm in performance process and technology
Large Scale Performance Problem Solving • How does our view of this process change when we consider very large-scale parallel systems? • What are the significant issues that will affect the technology used to support the process? • Parallel performance observation is clearly needed • In general, there is the concern for intrusion • Seen as a tradeoff with performance diagnosis accuracy • Scaling complicates observation and analysis • Performance data size becomes a concern • Analysis complexity increases • Nature of application development may change
Role of Intelligence, Automation, and Knowledge • Scale forces the process to become more intelligent • Even with intelligent and application-specific tools, the decisions of what to analyze is difficult and intractable • More automation and knowledge-based decision making • Build autonomic capabilities into the tools • Support broader experimentation methods and refinement • Access and correlate data from several sources • Automate performance data analysis / mining / learning • Include predictive features and experiment refinement • Knowledge-driven adaptation and optimization guidance • Address scale issues through increased expertise
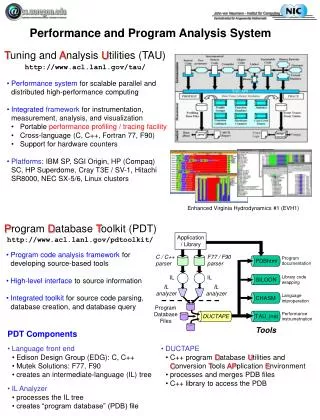
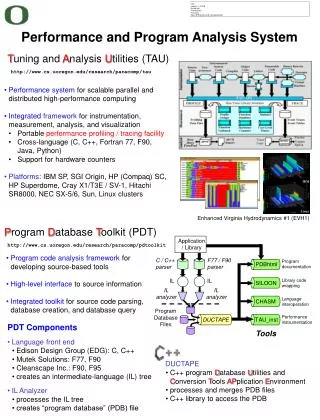
TAU Performance System • Tuning and Analysis Utilities (13+ year project effort) • Performance system framework for HPC systems • Integrated, scalable, flexible, and parallel • Targets a general complex system computation model • Entities: nodes / contexts / threads • Multi-level: system / software / parallelism • Measurement and analysis abstraction • Integrated toolkit for performance problem solving • Instrumentation, measurement, analysis, and visualization • Portable performance profiling and tracing facility • Performance data management and data mining • University of Oregon , Research Center Jülich, LANL
TAU Parallel Performance System Goals • Multi-level performance instrumentation • Multi-language automatic source instrumentation • Flexible and configurable performance measurement • Widely-ported parallel performance profiling system • Computer system architectures and operating systems • Different programming languages and compilers • Support for multiple parallel programming paradigms • Multi-threading, message passing, mixed-mode, hybrid • Support for performance mapping • Support for object-oriented and generic programming • Integration in complex software, systems, applications
Advances in TAU Instrumentation • Source instrumentation • Program Database Toolkit (PDT) • automated Fortran 90/95 support (Flint parser, very robust) • statement level support in C/C++ (Fortran soon) • TAU_COMPILER to automate instrumentation process • Automatic proxy generation for component applications • automatic CCA component instrumentation • Python instrumentation and automatic instrumentation • Continued integration with dynamic instrumentation • Update of OpenMP instrumentation (POMP2) • Selective instrumentation and overhead reduction • Improvements in performance mapping instrumentation
Advances in TAU Measurement • Profiling • Memory profiling • global heap memory tracking (several options) • Callpath profiling • user-controllable calling depth • Phase-based profiling • Online profile access • Tracing • Generation of VTF3 traces files (fully portable) • Inclusion of hardware performance counts in trace files • Hierarchical trace merging • Online performance overhead compensation • Component software proxy generation and monitoring
Profile Measurement – Three Flavors • Flat profiles • Time (or counts) spent in each routine (nodes in callgraph) • Exclusive/inclusive time, # of calls, child calls • Callpath Profiles • Time spent along a calling path (edges in callgraph) • “main=> f1 => f2 => MPI_Send” • TAU_CALLPATH_DEPTH environment variable) • Phase-based profiles • Flat profiles under a phase (nested phases are allowed) • Default “main” phase • Supports static or dynamic (per-iteration) phases
Advances in TAU Performance Analysis • Enhanced parallel profile analysis (ParaProf) • Callpath analysis integration in ParaProf • Event callgraph view • Performance Data Management Framework (PerfDMF) • First release of prototype • In use by several groups • S. Moore (UTK), P. Teller (UTEP), P. Hovland (ANL), … • Integration with Vampir Next Generation (VNG) • Online trace analysis • Performance visualization (ParaVis) prototype • Component performance modeling and QoS
Flat Profile – Pprof (NPB LU) • Intel Linux cluster • F90 + MPICH • Profile - Node - Context - Thread • Events - code - MPI
Callpath Profile 21-levelcallpath
Phase Profile – Dynamic Phases In 51st iteration, time spent in MPI_Waitall was 85.81 secs Total time spent in MPI_Waitall was 4137.9 secs across all 92 iterations
ParaProf – Manager performancedatabase derived performance metrics
ParaProf – Histogram View (Miranda) 8k processors 16k processors
Profiling of Miranda on BG/L (Miller, LLNL) • Profile code performance (automatic instrumentation) • Scaling studies (problem size, number of processors) • Run on 8K and 16K processors! 128 Nodes 512 Nodes 1024 Nodes
Fine Grained Profiling via Tracing on Miranda • Use TAU to generate VTF3 traces for Vampir analysis • Combines MPI calls with HW counter information • Detailed code behavior to focus optimization efforts
Memory Usage Analysis • BG/L will have limited memory per node (512 MB) • Miranda uses TAU to profile memory usage • Streamlines code • Squeeze largerproblems on themachine • TAU’s footprintis small • Approximately100 bytes per eventper thread Max Heap Memory (KB) used for 1283 problemon 16 processors of ASC Frost at LLNL
TAU Performance System Status • Computing platforms (selected) • IBM SP / pSeries, SGI Origin 2K/3K, Cray T3E / SV-1 / X1, HP (Compaq) SC (Tru64), Sun, Hitachi SR8000, NEC SX-5/6, Linux clusters (IA-32/64, Alpha, PPC, PA-RISC, Power, Opteron), Apple (G4/5, OS X), Windows • Programming languages • C, C++, Fortran 77/90/95, HPF, Java, OpenMP, Python • Thread libraries • pthreads, SGI sproc, Java,Windows, OpenMP • Compilers (selected) • Intel KAI (KCC, KAP/Pro), PGI, GNU, Fujitsu, Sun, Microsoft, SGI, Cray, IBM (xlc, xlf), HP, NEC, Absoft
Important Questions for Application Developers • How does performance vary with different compilers? • Is poor performance correlated with certain OS features? • Has a recent change caused unanticipated performance? • How does performance vary with MPI variants? • Why is one application version faster than another? • What is the reason for the observed scaling behavior? • Did two runs exhibit similar performance? • How are performance data related to application events? • Which machines will run my code the fastest and why? • Which benchmarks predict my code performance best?
Performance Problem Solving Goals • Answer questions at multiple levels of interest • Data from low-level measurements and simulations • use to predict application performance • High-level performance data spanning dimensions • machine, applications, code revisions, data sets • examine broad performance trends • Discover general correlations application performance and features of their external environment • Develop methods to predict application performance on lower-level metrics • Discover performance correlations between a small set of benchmarks and a collection of applications that represent a typical workload for a given system
Automatic Performance Analysis Tool (Concept) PSU: Kathryn Mohror, Karen Karavanic UO: Kevin Huck LLNL: John May, Brian Miller (CASC) PerfTrack Performance Database
TAU Performance Regression (PerfRegress) • Prototype developed by Alan Morris for Uintah • Re-implement using PerfDMF
ParaProf Performance Profile Analysis Raw files HPMToolkit PerfDMFmanaged (database) Metadata MpiP Application Experiment Trial TAU
PerfExplorer (K. Huck, UO) • Performance knowledge discovery framework • Use the existing TAU infrastructure • TAU instrumentation data, PerfDMF • Client-server based system architecture • Data mining analysis applied to parallel performance data • Technology integration • Relational DatabaseManagement Systems (RDBMS) • Java API and toolkit • R-project / Omegahat statistical analysis • Web-based client • Jakarta web server and Struts (for a thin web-client)
PerfExplorer Architecture Server accepts multiple client requests and returns results Server supports R data mining operations built using RSJava PerfDMF Java API used to access DBMS via JDBC Client is a traditional Java application with GUI (Swing) Analyses can be scripted, parameterized, and monitored Browsing of analysis results via automatic web page creation and thumbnails
PERC Tool Requirements and Evaluation • Performance Evaluation Research Center (PERC) • DOE SciDAC • Evaluation methods/tools for high-end parallel systems • PERC tools study (led by ORNL, Pat Worley) • In-depth performance analysis of select applications • Evaluation performance analysis requirements • Test tool functionality and ease of use • Applications • Start with fusion code – GYRO • Repeat with other PERC benchmarks • Continue with SciDAC codes
GYRO Execution Parameters • Three benchmark problems • B1-std : 16n processors, 500 timesteps • B2-cy : 16n processors, 1000 timesteps • B3-gtc : 64n processors, 100 timesteps (very large) • Test different methods to evaluate nonlinear terms: • Direct method • FFT (“nl2” for B1 and B2, “nl1” for B3) • Task affinity enabled/disabled (p690 only) • Memory affinity enabled/disabled (p690 only) • Filesystem location (Cray X1 only)
Primary Evaluation Machines • Phoenix (ORNL – Cray X1) • 512 multi-streaming vector processors • Ram (ORNL – SGI Altix (1.5 GHz Itanium2)) • 256 total processors • TeraGrid • ~7,738 total processors on 15 machines at 9 sites • Cheetah (ORNL – p690 cluster (1.3 GHz, HPS)) • 864 total processors on 27 compute nodes • Seaborg (NERSC – IBM SP3) • 6080 total processors on 380 compute nodes
Region (Events) of Interest • Total program is measured, plus specific code regions • NL : nonlinear advance • NL_tr* : transposes before / after nonlinear advance • Coll : collisions • Coll_tr* : transposes before/after main collision routine • Lin_RHS : compute right hand side of the electron and ion GKEs (GyroKinetic (Vlasov) Equations) • Field : explicit or implicit advance of fields and solution of explicit maxwell equations • I/O, extras Communication
Data Collected Thus Far… • User timer data • Self instrumentation in the GYRO application • Outputs aggregate data per N timesteps • N = 50 (B1, B3) • N = 125 (B2) • HPM (Hardware Performance Monitor) data • IBM platform (p690) only • MPICL profiling/tracing • Cray X1 and IBM p690 • TAU (all platforms, profiling/tracing, in progress) • Data processed by hand into Excel spreadsheets
PerfExplorer Analysis of Self-Instrumented Data • PerfExplorer • Focus on comparative analysis • Apply to PERC tool evaluation study • Look at user timer data • Aggregate data • no per process data • process clustering analysis is not applicable • Timings output every N timesteps • some phase analysis possible • Goal • Recreate manually generated performance reports
Comparative Analysis • Supported analysis • Timesteps per second • Relative speedup and efficiency • For entire application (compare machines, parameters, etc.) • For all events (on one machine, one set of parameters) • For one event (compare machines, parameters, etc.) • Fraction of total runtime for one group of events • Runtime breakdown (as a percentage) • Initial analysis implemented as scalability study • Future analysis • Arbitrary organization • Parametric studies
PerfExplorer Interface Experimentmetadata Select experiments and trials of interest Data organized in application, experiment, trial structure (will allow arbitrary in future)
PerfExplorer Interface Select analysis
Timesteps per Second • Cray X1 is the fastest to solution in all 3 tests • FFT (nl2) improves time for B3-gtc only • TeraGrid faster than p690 for B1-std? • Plots generated automatically B1-std B1-std TeraGrid B3-gtc B2-cy B3-gtc
Relative Efficiency (B1-std) • By experiment (B1-std) • Total runtime (Cheetah (red)) • By event for one experiment • Coll_tr (blue) is significant • By experiment for one event • Shows how Coll_tr behaves for all experiments Cheetah Coll_tr 16 processorbase case
Relative Speedup (B2-cy) • By experiment (B2-cy) • Total runtime (X1 (blue)) • By event for one experiment • NL_tr (orange) is significant • By experiment for one event • Shows how NL_tr behaves for all experiments
Fraction of Total Runtime (Communication) • IBM SP3 (cyan) has the highest fraction of total time spent in communication for all three benchmarks • Cray X1 has the lowest fraction in communication B1-std B2-cy B3-gtc