Performance Technology for Productive, High-End Parallel Computing
Performance Technology for Productive, High-End Parallel Computing. Allen D. Malony malony@cs.uoregon.edu Department of Computer and Information Science Performance Research Laboratory NeuroInformatics Center University of Oregon. Performance Tuning. Performance Technology. hypotheses.

Performance Technology for Productive, High-End Parallel Computing
E N D
Presentation Transcript
Performance Technology for Productive,High-End Parallel Computing Allen D. Malony malony@cs.uoregon.edu Department of Computer and Information Science Performance Research Laboratory NeuroInformatics Center University of Oregon
PerformanceTuning PerformanceTechnology hypotheses Performance Diagnosis • Experimentmanagement • Performancestorage PerformanceTechnology properties Performance Experimentation • Instrumentation • Measurement • Analysis • Visualization characterization Performance Observation Research Motivation • Tools for performance problem solving • Empirical-based performance optimization process • Performance technology concerns
Challenges in Performance Problem Solving • How to make the process more effective (productive)? • Process may depend on scale of parallel system • What are the important events and performance metrics? • Tied to application structure and computational model • Tied to application domain and algorithms • Process and tools can/must be more application-aware • Tools have poor support for application-specific aspects • What are the significant issues that will affect the technology used to support the process? • Enhance application development and benchmarking • New paradigm in performance process and technology
Large Scale Performance Problem Solving • How does our view of this process change when we consider very large-scale parallel systems? • What are the significant issues that will affect the technology used to support the process? • Parallel performance observation is clearly needed • In general, there is the concern for intrusion • Seen as a tradeoff with performance diagnosis accuracy • Scaling complicates observation and analysis • Performance data size becomes a concern • Analysis complexity increases • Nature of application development may change
Role of Intelligence, Automation, and Knowledge • Scale forces the process to become more intelligent • Even with intelligent and application-specific tools, the decisions of what to analyze is difficult and intractable • More automation and knowledge-based decision making • Build automatic/autonomic capabilities into the tools • Support broader experimentation methods and refinement • Access and correlate data from several sources • Automate performance data analysis / mining / learning • Include predictive features and experiment refinement • Knowledge-driven adaptation and optimization guidance • Address scale issues through increased expertise
Outline of Talk • Performance problem solving • Scalability, productivity, and performance technology • Application-specific and autonomic performance tools • TAU parallel performance system and advances • Performance data management and data mining • Performance Data Management Framework (PerfDMF) • PerfExplorer • Multi-experiment case studies • Clustering analysis • Comparative analysis (PERC tool study) • Future work and concluding remarks
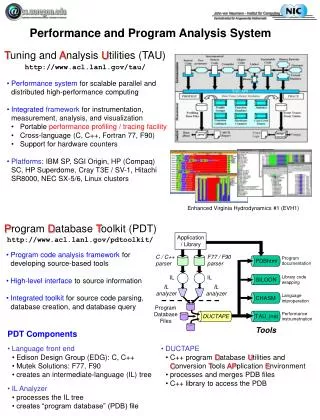
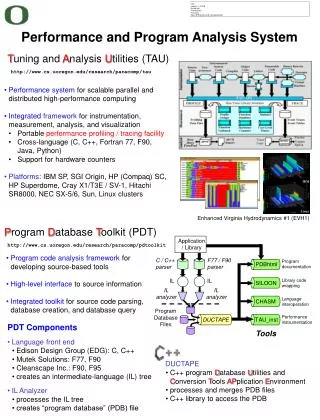
TAU Performance System • Tuning and Analysis Utilities (13+ year project effort) • Performance system framework for HPC systems • Integrated, scalable, flexible, and parallel • Targets a general complex system computation model • Entities: nodes / contexts / threads • Multi-level: system / software / parallelism • Measurement and analysis abstraction • Integrated toolkit for performance problem solving • Instrumentation, measurement, analysis, and visualization • Portable performance profiling and tracing facility • Performance data management and data mining • University of Oregon , Research Center Jülich, LANL
TAU Parallel Performance System Goals • Multi-level performance instrumentation • Multi-language automatic source instrumentation • Flexible and configurable performance measurement • Widely-ported parallel performance profiling system • Computer system architectures and operating systems • Different programming languages and compilers • Support for multiple parallel programming paradigms • Multi-threading, message passing, mixed-mode, hybrid • Support for performance mapping • Support for object-oriented and generic programming • Integration in complex software, systems, applications
TAU Performance System Architecture event selection
Advances in TAU Instrumentation • Source instrumentation • Program Database Toolkit (PDT) • automated Fortran 90/95 support (Cleanscape Flint parser) • statement level support in C/C++ (Fortran soon) • TAU_COMPILER to automate instrumentation process • Automatic proxy generation for component applications • automatic CCA component instrumentation • Python instrumentation and automatic instrumentation • Continued integration with dynamic instrumentation • Update of OpenMP instrumentation (POMP2) • Selective instrumentation and overhead reduction • Improvements in performance mapping instrumentation
Program Database Toolkit (PDT) Application / Library C / C++ parser Fortran parser F77/90/95 Program documentation PDBhtml Application component glue IL IL SILOON C / C++ IL analyzer Fortran IL analyzer C++ / F90/95 interoperability CHASM Program Database Files Automatic source instrumentation TAU_instr DUCTAPE
Advances in TAU Measurement • Profiling (four types) • Memory profiling • global heap memory tracking (several options) • Callpath profiling and calldepth profiling • user-controllable callpath length and calling depth • Phase-based profiling • Tracing • Generation of VTF3 / SLOG traces files (fully portable) • Inclusion of hardware performance counts in trace files • Hierarchical trace merging • Online performance overhead compensation • Component software proxy generation and monitoring
Profile Measurement • Flat profiles • Metric (e.g., time) spent in an event (callgraph nodes) • Exclusive/inclusive, # of calls, child calls • Callpath profiles (Calldepth profiles) • Time spent along a calling path (edges in callgraph) • “main=> f1 => f2 => MPI_Send” (event name) • TAU_CALLPATH_LENGTH environment variable • Phase-based profiles • Flat profiles under a phase (nested phases are allowed) • Default “main” phase • Supports static or dynamic (per-iteration) phases
Advances in TAU Performance Analysis • Enhanced parallel profile analysis (ParaProf) • Callpath analysis integration in ParaProf • Event callgraph view • Performance Data Management Framework (PerfDMF) • First release of prototype • In use by several groups • S. Moore (UTK), P. Teller (UTEP), P. Hovland (ANL), … • Integration with Vampir Next Generation (VNG) • Online trace analysis • 3D Performance visualization prototype (ParaVis) • Component performance modeling and QoS
Pprof – Flat Profile (NAS PB LU) • Intel Linux cluster • F90 + MPICH • Profile - Node - Context - Thread • Events - code - MPI • Metric - time • Text display
ParaProf – Manager Window performancedatabase derived performance metrics
ParaProf – Full Profile (Miranda) 8K processors!
ParaProf– Callpath Profile (ESMF) 21-levelcallpath
ParaProf – Phase Profile (MFIX) In 51st iteration, time spent in MPI_Waitall was 85.81 secs dynamic phases one per interation Total time spent in MPI_Waitall was 4137.9 secs across all 92 iterations
ParaProf – Histogram View (Miranda) • Scalable 2D displays 16k processors 8k processors
ParaProf – Callpath Highlighting (Flash) MODULEHYDRO_1D:HYDRO_1D
Profiling of Miranda on BG/L (Miller, LLNL) • Profile code performance (automatic instrumentation) • Scaling studies (problem size, number of processors) • Run on 8K and 16K processors! 128 Nodes 512 Nodes 1024 Nodes
ParaProf – 3D Full Profile (Miranda) 16k processors
ParaProf – 3D Scatterplot (Miranda) • Each pointis a “thread”of execution • A total offour metricsshown inrelation • ParaVis 3Dprofilevisualizationlibrary • JOGL
Performance Tracing on Miranda • Use TAU to generate VTF3 traces for Vampir analysis • MPI calls with HW counter information (not shown) • Detailed code behavior to focus optimization efforts
TAU Performance System Status • Computing platforms (selected) • IBM SP/pSeries, SGI Origin, Cray T3E/SV-1/X1/XT3, HP (Compaq) SC (Tru64), Sun, Hitachi SR8000, NEC SX-5/6, Linux clusters (IA-32/64, Alpha, PPC, PA-RISC, Power, Opteron), Apple (G4/5, OS X), Windows • Programming languages • C, C++, Fortran 77/90/95, HPF, Java, OpenMP, Python • Thread libraries (selected) • pthreads, SGI sproc, Java,Windows, OpenMP • Compilers (selected) • Intel KAI (KCC, KAP/Pro), PGI, GNU, Fujitsu, Sun, PathScale, SGI, Cray, IBM (xlc, xlf), HP, NEC, Absoft
Project Affiliations (selected) • Center for Simulation of Accidental Fires and Explosion • University of Utah, ASCI ASAP Center, C-SAFE • Uintah Computational Framework (UCF) (C++) • Center for Simulation of Dynamic Response of Materials • California Institute of Technology, ASCI ASAP Center • Virtual Testshock Facility (VTF) (Python, Fortran 90) • Earth Systems Modeling Framework (ESMF) • NSF, NOAA, DOE, NASA, … • Instrumentation for ESMF framework and applications • C, C++, and Fortran 95 code modules • MPI wrapper library for MPI calls
Project Affiliations (selected) (continued) • Lawrence Livermore National Lab • Hydrodynamics (Miranda), Radiation diffusion (KULL) • Sandia National Lab and Los Alamos National Lab • DOE CCTTSS SciDAC project • Common component architecture (CCA) integration • Argonne National Lab • OS / RTS for Extreme Scale Scientific Computation • Zeptos - scalable components for petascale architectures • KTAU - integration of TAU infrastructure in Linux kernel • Oak Ridge National Lab • Contribution to the Joule Report: S3D, AORSA3D
Important Questions for Application Developers • How does performance vary with different compilers? • Is poor performance correlated with certain OS features? • Has a recent change caused unanticipated performance? • How does performance vary with MPI variants? • Why is one application version faster than another? • What is the reason for the observed scaling behavior? • Did two runs exhibit similar performance? • How are performance data related to application events? • Which machines will run my code the fastest and why? • Which benchmarks predict my code performance best?
Performance Problem Solving Goals • Answer questions at multiple levels of interest • Data from low-level measurements and simulations • use to predict application performance • High-level performance data spanning dimensions • machine, applications, code revisions, data sets • examine broad performance trends • Discover general correlations application performance and features of their external environment • Develop methods to predict application performance on lower-level metrics • Discover performance correlations between a small set of benchmarks and a collection of applications that represent a typical workload for a given system
Performancedatabase Automatic Performance Analysis Tool (Concept) 105% Faster! 72% Faster! Simpleanalysisfeedback Build application Execute application environment /performancedata build information Offline analysis
ParaProf Performance Profile Analysis Raw files HPMToolkit PerfDMFmanaged (database) Metadata MpiP Application Experiment Trial TAU
PerfExplorer (K. Huck, Ph.D. student, UO) • Performance knowledge discovery framework • Use the existing TAU infrastructure • TAU instrumentation data, PerfDMF • Client-server based system architecture • Data mining analysis applied to parallel performance data • comparative, clustering, correlation, dimension reduction, ... • Technology integration • Relational DatabaseManagement Systems (RDBMS) • Java API and toolkit • R-project / Omegahat statistical analysis • WEKA data mining package • Web-based client
PERC Tool Requirements and Evaluation • Performance Evaluation Research Center (PERC) • DOE SciDAC • Evaluation methods/tools for high-end parallel systems • PERC tools study (led by ORNL, Pat Worley) • In-depth performance analysis of select applications • Evaluation performance analysis requirements • Test tool functionality and ease of use • Applications • Start with fusion code – GYRO • Repeat with other PERC benchmarks • Continue with SciDAC codes
Primary Evaluation Machines • Phoenix (ORNL – Cray X1) • 512 multi-streaming vector processors • Ram (ORNL – SGI Altix (1.5 GHz Itanium2)) • 256 total processors • TeraGrid • ~7,738 total processors on 15 machines at 9 sites • Cheetah (ORNL – p690 cluster (1.3 GHz, HPS)) • 864 total processors on 27 compute nodes • Seaborg (NERSC – IBM SP3) • 6080 total processors on 380 compute nodes
GYRO Execution Parameters • Three benchmark problems • B1-std : 16n processors, 500 timesteps • B2-cy : 16n processors, 1000 timesteps • B3-gtc : 64n processors, 100 timesteps (very large) • Test different methods to evaluate nonlinear terms: • Direct method • FFT (“nl2” for B1 and B2, “nl1” for B3) • Task affinity enabled/disabled (p690 only) • Memory affinity enabled/disabled (p690 only) • Filesystem location (Cray X1 only)
PerfExplorer Analysis of Self-Instrumented Data • PerfExplorer • Focus on comparative analysis • Apply to PERC tool evaluation study • Look at user timer data • Aggregate data • no per process data • process clustering analysis is not applicable • Timings output every N timesteps • some phase analysis possible • Goal • Recreate manually generated performance reports
PerfExplorer Interface Experimentmetadata Select experiments and trials of interest Data organized in application, experiment, trial structure (will allow arbitrary in future)
PerfExplorer Interface Select analysis