Technology & Innovations Management models for presentations
100 Technology & Innovations Management models, diagrams and charts for powerful business presentations and knowledge. Content: Entrepreneurship, Venture Models, Driving Forces, Venture Capital, Growth Phases, Technology Life Cycle, The Chasm Model, The Transilience Map, Diffusion Curve, Technology Strategies, Knowledge Creation Process, Innovation Management, First Mover Advantage, Technology Acquisition, Core Technologies, Technology Portfolio, Patent Management, Intellectual Property, Innovation Types, Kano Model, R&D, New Technologies, Risk Bubble Diagram, Technology Evolution, E-Business Models, Growth Strategies, Start-up, Private Equity, Financing Life Cycle, Product Innovation Process More business diagrams to download on http://www.drawpack.com your visual business knowledge

Technology & Innovations Management models for presentations
E N D
Presentation Transcript
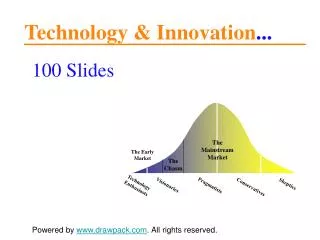
Technology & Innovation... 100 Slides The Chasm The Mainstream Market The Early Market Technology Enthusiasts Skeptics Visionaries Pragmatists Conservatives Powered by www.drawpack.com. All rights reserved.
Key Words... Entrepreneurship – Venture Models – Driving Forces – Venture Capital – Growth Phases – Technology Life Cycle – The Chasm Model – The Transilience Map – Diffusion Curve – Technology Strategies – Knowledge Creation Process – Innovation Management – First Mover Advantage – Technology Acquisition – Core Technologies – Technology Portfolio – Patent Management – Intellectual Property – Innovation Types – Kano Model – R&D – New Technologies – Risk Bubble Diagram – Technology Evolution – E-Business Models – Growth Strategies – Start-up – Private Equity – Financing Life Cycle – Product Innovation Process
Who is the Entrepreneur? High Entrepreneur Inventor CREATIVITY AND INNOVATION Manager, Administrator Promoter Low High GENERAL MANAGEMENT SKILLS, BUSINESS KNOW-HOW, AND NETWORKS
Fit of Entrepreneur and Venture Capital High Low Potential for singles or doubles, but many strike out Potential for triples and home runs ATTRACTIVENESS OF VENTURE OPPORTUNITY Not hat and no cattle Big hat, no cattle High Low ENTREPRENEUR‘S FIT AND BALANCE
Central Issues in Entrepreneurial Finance Shareholders Value Creation Customers Employees Allocating risks and returns Slicing the value pie Cash-Risk-Time Debt: Take control Covering risk Equity: Staged commitments
Dominant Venture Modes Seed/Startup High Growth Maturity Most Most Higher potential, growth-minded ventures Higher potential, growth-minded ventures ENTREPRENEURIAL CHANGE AND UNCERTAINTY Mature, bureaucratic dinosaurs Lifestyle, Mom and Pop ventures Least Least Least Most ADMINISTRATIVE Entrepreneurial domain Administrative domain
Principle Driving Forces Seed/Startup High Growth Maturity Most Most Driven by: Driven by: • Collaboration within the firm • Opportunity focus • Resource requirements expanding • Organization: Informal; fluid • Rejuvenators and innovators • Opportunity focus • Resource ownership • Organization: Formal ENTREPRENEURIAL CHANGE AND UNCERTAINTY Driven by: Driven by: • Administration/trustees • Product focus • Resource ownership • Organization: Formal • Few owners • A specific product • Burdensome resource requirements • Organization: None or too rigid Least Least Least Most ADMINISTRATIVE Entrepreneurial domain Administrative domain
Financial Strategy Framework Opportunity Financial strategy Degrees of strategic freedom: Time to OOC Time to close Future alternatives Risk/Reward Personal concerns Sources and deal structure Dept Equity Other Business strategy Marketing Operations Finance Value creation Financial requirements Driven by: Burn rate Operating needs Working capital Asset requirements and sales
The Five Tasks of Strategic Management Fund conception Target investment opportunities Raise capital for investment Generate deal flow New and young companies with high potential Fund conception Target investment opportunities Fund conception Target investment opportunities • Add value via: • Strategy development • Acitve board membership • Attract outside expertise • Attract later round investors • Attract other stakeholders, management • Provide contacts, access to info, people, institutions Typically 5 to 10 year window • Craft and execute • exit strategies • Sale • Liquidation • IPO • Alliances • Merger
Flows of Venture Capital Investors Venture Capital Firms Portfolio Companies Use capital Provide capital • Identity and screen opportunities • Transact and close deals • Monitor and add value • Harvest • Raise additional funds MONEY MONEY Limited partners Pension funds Individuals Corporations Insurance companies Foreign Endowments Opportunity Creation recognition and execution 2-3% ANNUAL FEE General partners 15-25% of capital gains IPOs/Mergers/Alliances Entrepreneurs Return of principal plus 75-85% of capital gain Value-creation and harvest EQUITY
Growth Phases Phase 1 Phase 2 Phase 5 Phase 3 Phase 4 Large 5. Crisis of ? 4. Crisis of RED TAPE 5. Growth through COLLABORATION 3. Crisis of CONTROL 4. Growth through COORDINATION SIZE OF ORGANIZATION 2. Crisis of AUTONOMY 3. Growth through DELEGATION 1. Crisis of LEADERSHIP 2. Growth through DIRECTION Evolution stages Revolution stages 1. Growth through CREATVITY Small Young Mature AGE OF ORGANIZATION
A Way to Think about Potential Not Obvious Black Holes Home Runs CONCEPT Squirrel Cages Filling Stations Obvious Small Large GROWTH / ULTIMATE FINANCIAL POTENTIAL
Four Archetypal Structural Approaches to Coordination High Laissez-faire Management Professional Management DELEGATION OF RESPONSIBILITY Bureaucratic Management Entrepreneurial Management Low Low High USE OF FORMAL CONTROL MECHANISMS
The Technology Adoption Life Cycle • Innovators • Early Adopters • Early Majority • Late Majority • Laggards • Technology Enthusiasts • Visionaries • Pragmatists • Conservatives • Skeptics
The Chasm The Chasm The Mainstream Market The Early Market Technology Enthusiasts Skeptics Visionaries Pragmatists Conservatives
Amar Bidhé Framework „Regular“ Start-ups Promising Revolutionary High VC Backed Startups UNCERTAINTY Marginal Corporate Low „Regular“ Corporation Low High SCALE Uncertainty: unqualifiable and immeasurable risk Scale: expected total profit from opportunity
On Innovation Why do firms innovate? Appropriability (patent, secrecy...) Novelty Product innovation Escaping from perfect competition Consumers accept to pay a higher price Price > marginal cost Monopoly rent Economic value Rent X market share (trade off) Monopoly rent Price > marginal cost Costs are decreasing Escaping from perfect competition Process innovation Appropriability (patent, secrecy...) Novelty
Framework for Investigating the Impact of Innovation on Growth and Employment TECHNOLOGICAL CHANGE Industry-specific opportunities for innovation in firms Behavior of firms: NON INNOVATING FIRMS FIRMS INNOVATING MAINLY IN PROCESSES FIRMS INNOVATING MAINLY IN PRODUCTS Innovative strategy of firms: No R&D and innov. exp. Stable productivity Cost savings, low quality Some R&D and innov. exp. mainly for investment Growing productivity through restructuring Defence of market shares through cost reductions High R&D and innov. exp. mainly for new products Growing productivity through higher quality Expans. of market share Search for new markets and monopoly profits Competitive strategy: Passive price competitiveness Active price competitiveness Technological competitiveness External conditions of markets and demand: Stagnant Growing Stagnant Stagnant Growing Growing Losing out to competitors Falling or stable market shares Stable or slow growing market shares (at the expense of competitors) Fast growing market shares Developm. of new markets Outcomes for the firm: Strong fall of value added and employm. Stable value added, falling employm. with growth of productivity Slow growth of value added, stable employm. with growth of productivity Strong growth of value added, some employm. growth Outcomes for the industry:
Types of Lock-In and Types of Switching Costs Type of lock-in Contractual commitments Durable purchases Brand-specific training Information and data bases Specialized suppliers Search costs Loyalty programs Switching costs Compensatory or liquidated damages Replacement or equipment; tends to decline as the durable ages Learning a new system, both direct costs and lost productivity; tends to decline as people learn to learn Converting data to new format; tends to rise over time as collection grows Funding of new supplier; may rise over time if capabilities are hard to find Combined buyer and seller search costs; includes learning about quality of alternatives Any lost benefits from incumbent supplier, plus need to rebuild cumulative use
The Transilience Map BREAKTHROUGH Architectural Niche creation Technology Market Customers Production Revolutionary Regular CONTINUITY
Organizational Capabilities C A B SM SM SM F1 F1 F2 F3 F4 F2 F3 F4 F1 F2 F3 F4 P1 P P2 P P3 Functional matrix Balanced matrix Functional F D E SM SM SM P1 P1 P2 P3 P4 P2 P3 P4 P4 F1 F2 F1 P3 F3 P2 F4 F2 P1 F3 F4 Project-led organization Project-based organization Project matrix
A New Kind of Competition: Winner-Take-All 100 Winner MARKET SHARE (in %) 50 Battle zone Loser 0 TIME
The Classical Diffusion Curve Adoption Dynamics Saturation Takeoff NUMBER OF USERS Launch TIME
Positive Feedback's Should not be Confused with Growth Popularity Adds Value in a Network Industry Virtuous cycle VALUE TO USER Vicious cycle NUMBER OF COMPATIBLE USERS
The Whole Product Model Potential Product Augmented Product Expected Product Generic Product
The Simplified Whole Product Model Standards and Procedures Additional Software Training and Support Additional Hardware Anything else you would need to achieve your compelling reason to buy Generic Product System Integration Cables Installation and Debugging
The Competitive-Positioning Compass SUPPORTERS Product Company Visionaries Conservative Crossing the Chasm Developing the Early Market Developing the Mainstream Market SPECIALIST GENERALIST Technology Enthusiasts Pragmatist Technology Market SKEPTICS
Define the Battle SUPPORTERS • Benchmarks • Product Reviews • Design wins • Initial sales volumes • Trade press coverage • Visionary endorsements • Revenues and profits • Strategic partners • Top tier customers • Full product line • Business press coverage • Financial analyst endorsements Product Company SPECIALIST GENERALIST Technology Market • Architecture • Schematics • Demos • Trials • Technology press coverage • Guru endorsements • Market share • Third party support • Standards certification • Applications proliferation • Vertical press coverage • Industry analyst endorsements SKEPTICS
Discontinuity and Life Cycle High Early Market Prototypes Pure Science Chasm Visionaries Technology Enthusiasts PARADIGM SHOCK Conservatives Pragmatists End of Life Bowling Alley Main Street Low Tornado High Low APPLICATION BREAKTHROUGH
Development of Technological Entrepreneurial Regions Scientific/ Technical Knowledge Academic Institutions Technological Enterprise Venture Capital Available Capital Trained Individuals Service Enterprise Growth Economic & Employment Growth Unsuccessful Successful Spin-Off Enterprise
Technological Enterprise Space High TECHNOLOGY Future New Low MARKET Emerging Existing Incremental Radical Existing New Generation INNOVATION
Technological Strategic Planning Model • Evaluation of: • Organization‘s • - Strengths • - Weaknesses • Environmental • - Opportunities • - Threats • Core Competencies • Overall • Strategic Business • Units Corporate Strategy Vision, Objectives, Goals Technological Strategy Action Plan • Emerging • Technologies • Assessment • Technological • Forecast • Environmental • Analysis • Internal • External
Knowledge Creation Pyramid Competitive Advantage Continuous Innovation Knowledge Creation
Technology Strategy Risk-Return Space High Cost Reduction Technology Peripheral Push Pull RETURN Product Line Extension High Trend Expanding Market Low Trend Mature Market Low or Negative RISK
Two-Dimensional Technological Space Radical New Generation TECHNOLOGY Incremental Existing Existing Emerging New Future MARKET
Innovation Feedback Process Expertise Technology, customers, markets, expertise, patents, trademarks, trade secrets Invention Implementation Market Penetration Market space, competitors, suppliers Economic Power
Nested Enterprise Strategy Sets Strategy Mission Vision
Key Elements of Business and Technological Strategy Domains Business Elements Technology Elements Market Forecasts Technology Forecasts Programs Enterprise Objectives Mission Space Technological Space General Needs Technologies Specific Requirements Technological Applications Increasing Detail Projects Drives Bounds
Technological Risk Domain High RISK Moderate Low Existing Incremental Improvement New Generation Radical TECHNOLOGY
Trilogy of Strategic Technology Decisions Which Way to Go Decision Leadership Team Technological Potential Make or Buy Decision Keep or Sell Decision Technologies Structures Processes Product, Process or Service System Functions $
Relationship of Needs, Core Technologies and Competencies Market Products, Processes or Services Needs Core Technologies Technologies to Meet Needs Core Competencies Defining Capabilities
Strategic Technology Position 1 Core Technology Region New Technology Vector TECHNOLOGICAL ATTRACTIVENESS Aging Technology 0 10 COMPETITIVE TECHNOLOGICAL STRENGTHS
Technological SWOT Analysis Diagram Numerous Enterprise Environmental Opportunities Turnaround Strategy Aggressive Strategy Substantial Enterprise Technological Strengths Critical Enterprise Technological Weaknesses Defensive Strategy Diversification Strategy Major Technological Environmental Threats
Technological Strategic Clusters Emerging technology market with rapid growth („Go-for-it“) („Niche“) II I Strong technological competitive position Weak technological competitive position III IV („No-Go or Change it“) („Partnering“) Existing technology market with slow to moderate growth
Internal and External Interactions for Technological Strategy Development External Environment External Forces Enterprise Business Strategy Differentiating Capabilities Competencies and Technologies Technological Strategy Organizational Learning Internal Culture Enterprise Internal Environment
Components of a Competitive Analysis What drives the competition? What the competition is doing and can do? ? ? ? ? ? ? ? ? ? ? Future Goals Current Strategy Competitor‘s Response Profile Strengths Weaknesses Threats Opportunity Assumptions Held about itself and the industry Capabilities Strengths and weaknesses
Impact of Competitive Advantage SIZE OF TECHNOLOGICAL COMPETITVE ADVANTAGE Small Large Volume Stalemate ROI ROI Few NUMBER OF WAYS TO ACHIEVE TECHNOLOGICAL COMPETITIVE ADVANTAGE Market share Market share Technological Competitive Differentiation Specialization Fragmented ROI ROI Many Market share Market share Barriers of Entry to Technological Market Space
First Mover Advantage Model Environmental Opportunity Attractiveness Competitive Strategy • First-Mover • Distinctive Competencies • Resources • Later-Entrant • Distinctive Competencies • Resources Competitive Strategy First-Mover Positional Advantages CostDifferentiation • Later-Entrant • Advantages • Imitation Costs • Free-Rider Effects • Scope Economics • Learning from • Pioneer‘s Mistakes Pre-emption Factors Technological Factors Behavioral Factors Economic Factors Demand Uncertainty Pre-emptive Investment Technological Innovation Characteristics Nature of Good Entry Scale Product Characteristics Technological Change & Discontinuity Market Type Efficient Scale-to- Market Size Market Evolution Advertising Intensity Buyer‘s Investment in Cospecialized Assets Response Time Scope Economies Overall Magnitude of First-Mover Advantage • Market Share Performance • Absolute • Relative • Profitability Performance • Return on Assets • Return on Sales
Financing Life Cycle Venture Capitalist Investment Banks & Banks FFF & Angels Early Growth Later Growth Seed Capital & Early Stage Enterprise Cash Flow Enterprise Financing Mezzanine Public Market 3rd 2nd Initial Public Offering 1st Time Valley of Death Break-even point Emerging Growth
Break-Even Regions Cash flow Returned capital breakeven Cumulative revenue Cash flow breakeven $ EVA breakeven Opportunity cost based on capital risk assumed P&L breakeven