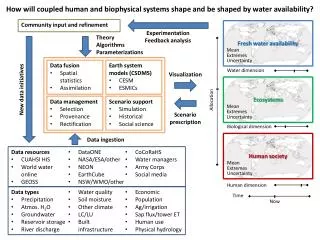
AVAILABILITY OF EXCESS CAP WATER
150 likes | 286 Vues
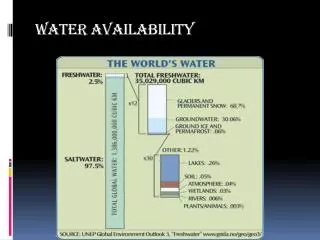
AVAILABILITY OF EXCESS CAP WATER. Colorado River Allocations. Upper Basin – 7.5 MAF. Lower Basin - 7.5 MAF CA – 4.4 MAF AZ – 2.8 MAF On-river users ………. 1.3 ± MAF CAP (junior priority)... 1.5 ± MAF NV – 0.3 MAF. MX – 1.5 MAF. COLORADO RIVER SUPPLY Modeling Assumptions.

AVAILABILITY OF EXCESS CAP WATER
E N D
Presentation Transcript
Colorado River Allocations Upper Basin – 7.5 MAF • Lower Basin - 7.5 MAF • CA – 4.4 MAF • AZ – 2.8 MAF • On-river users ………. 1.3 ± MAF • CAP (junior priority)... 1.5 ± MAF • NV – 0.3 MAF MX – 1.5 MAF
COLORADO RIVER SUPPLY Modeling Assumptions • Current Reservoir Conditions (Jan.1, 2003) • Lake Mead (Elevation 1152, 17 maf storage, 61% capacity) • Lake Powell (Elevation 3620, 14 maf storage, 57% capacity) • 70R Surplus Criteria • 80% Protection of 1,050’ Lake Mead elevation • YDP Operational in 2009 • Upper Basin Limit = 4.8 maf • Interim Surplus Guidelines Through 2016
COLORADO RIVER SUPPLY Modeling Assumptions cont’d • CAP Shortage Volume -- 500 KAF • CAP Surplus Volume -- 400 KAF • 96 years of Colorado River hydrology used in sequential traces (1906 - 2001)
COLORADO RIVER SUPPLY Modeling Results DecadeShortage ProbabilitySurplus Probability 2003-2012 3% 11% 2013-2022 18% 23% 2023-2032 25% 19% 2033-2042 28% 19% 2043-2052 31% 17% 2053-2062+ 33% 12% Additional: • Current Dry Cycle since 1988 - 15+ years • Worst Case Scenario using Driest 10-year period of record with current conditions - results in a potential shortage in 2014.
KEY ASSUMPTIONS • Planning Period 2005 – 2104 • 20 YEAR PERIOD = 2005 – 2024 • 80 YEAR PERIOD = 2025 - 2104 • Entire Period = CAP Normal Deliveries • GRIC Settlement Completed/Implemented • All CAP Water Contracted/Used by 2050 • SRP “Drought” Deliveries End After 2005
Colorado River Flow Arizona’s Colorado River Supply Upper Basin Demands Reservoir Storage Arizona’s “On-River” Demands Other Lower Basin Demands CAP Losses CAP Water Supply M&I Subcontracts (Includes CAGRD M&I Subcontract) M&I Indian Lease Contracts Indian On-reservation Contracts NIA Allocation – Excess Water NIA Excess Commitment (2004 – 2030) CAGRD Remaining Annual Obligation M&I Incentive Other AWBA Purposes (On-River, Indian Settlement, Interstate Storage) CAGRD Reserve & AWBA M&I Firming Shared Pool Remaining Excess Supply SRP “Drought Supply” Direct Use Excess CAP WATER SUPPLY & CONCEPTUAL DELIVERY PRIORITY SCHEMATIC
CAP DEMAND PROJECTION PROCESS M&I SUBCONTRACT DEMANDS INDIAN ON-RESERVATION DEMANDS M&I INDIAN LEASE DEMANDS Project Build out Schedules NIA – EXCESS WATER DEMANDS Tribal Development Plans BOR Projections Customer Development Plans Outlook 2003 Water Use Studies CAGRD Plan of Operation EXCESS DEMANDS CAWCD Ag Pool Policy (2004 – 2030) CAGRD Build out Plan Estimated Direct Use & Incentive Demands AWBA Demands Projected SRP Demands
Plan Period Enrollment Buildout MSA “buildout”
Plan Period Enrollment Buildout MSA “buildout”
REMAINING EXCESS WATER AVAILABLE (after NIA commitment)* TOTAL 3,956,100 (5,760,000) 5,328,400 (9,278,000) 7,594,600 (13,706,000) *Demands shown in Blue **Does not include 1.1 maf Interstate + .6maf Indian Firming
EXCESS WATER SUPPLY CONCLUSIONS • Ag Pool Commitment 2004 – 2030 will be met • Remaining Excess Supply Insufficient to Meet Projected Annual Obligations in 2016, 2018 –2030, & 2051 - 2104 • Remaining Excess Supply Insufficient to Meet Projected AWBA Needs • Remaining Excess Supply Insufficient to Meet Replenishment Reserve Target ABSENT Acquisition of Long-Term Supplies