Water Availability
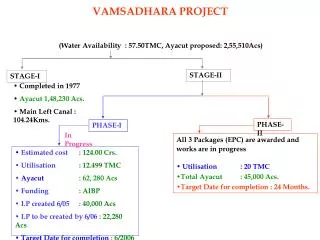
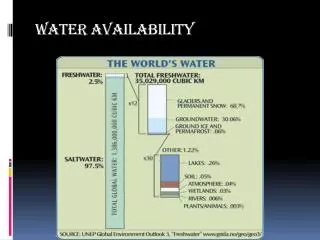
Water Availability. Transboundary Waters. Only this portion is renewable. Global Water Resources. Total = 1,386,000,000 km3 Fresh = 35,029,000 km3 (2.5% of total). Principal sources of fresh water for human activities 44,800 km 3. Global Water Cycle. Global Water Availability.

Water Availability
E N D
Presentation Transcript
Water Availability TransboundaryWaters
Only this portion is renewable Global Water Resources Total = 1,386,000,000 km3 Fresh = 35,029,000 km3 (2.5% of total)
Principal sources of fresh water for human activities 44,800 km3 Global Water Cycle
Population and Water Use global freshwater use is ~4000 km3/year ~10% of the renewable supply (44,800km3/year)
Waterin ecosystems and social systems M.FalkenmarkMarch 09
Waterin twoforms M.Falkenmark March 09
Global waterbudget Precipitation 100 % 65 % 35 % M.Falkenmark March 09
A basicdevelopmentobstacle:watervariability • in water-constrained economies • hydrologicvariability • complicates food production December rainfall Cereal yield M.Falkenmark March 09
Access to Water Supply • Reasonable access to an adequate amount of safe water • Treated surface water and untreated but uncontaminated water, such as from springs, sanitary wells, and protected boreholes • Urban areas - public fountain or standpipe located not more than 200 meters away. • Rural areas - members of the household do not have to spend a disproportionate part of the day fetching water. • An adequate amount of water is that needed to satisfy metabolic, hygienic, and domestic requirements Worldbank.org
Access to Sanitation • At least adequate excreta disposal facilities • Private or shared, but not public • Effectively prevent human, animal, and insect contact with excreta. • Suitable facilities range from simple but protected pit latrines to flush toilets with sewerage. • To be effective, all facilities must be correctly constructed and properly maintained. Worldbank.org
Water Supply and Sanitation • In 2002 • 1.1 billion people lacked access to improved water sources (17% of the global population) • Of those, nearly two thirds live in Asia (733 million people) • In sub-Saharan Africa, 42% of the population is without improved water • 2.6 billion people lacked access to improved sanitation (42% of the world’s population) • Over half of those live in China and India (nearly 1.5 billion people) • In sub-Saharan Africa, sanitation coverage is only 36%. • In developing countries, 69% of rural dwellers lack access to improved sanitation, as opposed 27% of urban dwellers.
Water Supply and Sanitation • Diarrhea (WHO 2004) • 1.8 million people die every year from diarrheal diseases (including cholera); 90% are children under 5, mostly in developing countries • 88% of diarrheal disease is attributed to unsafe water supply, inadequate sanitation and hygiene • Improved access to water supply and sanitation can reduce diarrhea morbidity • Water supply: 6% – 25% (108,000 – 450,000 people) • Sanitation: 32% (576,000 people) • Total: 1.026 million http://www.who.int/water_sanitation_health/diseases/burden/en/index.html
Poverty and Development • > 1 billion people live in extreme poverty (< $1 a day) • Sub-Saharan Africa - > 15 of every 100 children die before the age of 5 • Kenya - fertilizer costs > 2x what it costs in France or the U.S. • Ethiopia - so deforested that rural households cannot use manure as fertilizer because they need it as cooking fuel. • In 2002 developed countries promised to give $210 billion (0.7% of GNP) in ODA to end poverty • 2005 - gave $107 billion (U.S. $28 bln)* • 2008 – gave $120 billion (U.S. $26 bln) • 2015 – need $195 billion * $4.3 bln for WSS http://www.unmillenniumproject.org/resources/fastfacts_e.htm http://stats.oecd.org/qwids
Challenges & U.S. Response • What’s the problem? • Lack of capacity • Competing interests • Decentralization • It’s not all about water • It’s also about: political will, governance, and globalization • Senator Paul Simon “Water for the Poor Act”2005* • Recognizes importance of water and codified the internationally agreed goals (MDGs) • Objectives of U.S. strategy • Increase access to, and effective use of, safe water and sanitation *2010 - http://www.state.gov/documents/organization/146141.pdf *2011 - http://www.state.gov/documents/organization/166895.pdf
International River Basins Over 40% of the world lives in a shared basin (263 of ‘em) GEO-3: GLOBAL ENVIRONMENT OUTLOOK http://www.unep.org/GEO/geo3/english/fig154.htm
Water Wars? Unlikely. • Harbingers of conflict that should be considered: • Unilateral development • Internationalized basin • No / ineffective institutions • General animosity • Downstream hegemony • Some warning signs: • Large scale development • Rapid changes • Civil unrest
Water in the International Arena • We continuously read about the threat of "water wars" in the press, where one country is likely to use military force to achieve its objectives of water use. • Several international groups have warned of the threat of a "water crisis" looming in the coming century. • Several area of the world are regularly mentioned as having tense negotiations over shared river basins: Jordan, Ganges-Bramaputra, and Tigres-Euphrates. • In US, shared water resources with Canada and Mexico are now under increased scrutiny and negotiation resulting from the environmental side agreement to the North American Free Trade Agreement. • In EU, multiple water “directives” are being implemented across 25 nations.
Domestic Water Use • Survival = 5 L/day • Drinking, cooking, bathing, and sanitation = 50 L • United States = 250 to 300 L (Includes yard watering) • Netherlands = 104 L • Somalia = 9 L • 100-600 L/c/d* (high-income) • 50-100 L/c/d (low-income) • 10-40 L/c/d (water scarce) * L/c/d = liters per person per day
Water Stress Index • Based on human consumption • linked to population growth • Domestic requirement: • 100 L/c/d = 40 m3/c/yr • Associated agricultural, industrial & energy need: • 20 x 40 m3/c/yr = 800 m3/c/yr • Total need: • 840 m3/c/yr • about 1000 m3/c/yr
Water Stress Index • Water availability below 1,000 m3/c/yr • chronic water related problems impeding development and harming human health • Water sufficiency: >1700 m3/c/yr • Water stress: <1700 m3/c/yr • Water scarcity: <1000 m3/c/yr
Water Supply Improved Not Improved Unprotected well Unprotected spring Vendor-provided water Bottled water* Tanker truck-provided water • Household connection • Public standpipe • Borehole • Protected dug well • Protected spring • Rainwater collection World Health Organization
Sanitation Improved Not Improved Service or bucket latrines (where excreta are manually removed) Public latrines Latrines with an open pit • Connection to a public sewer • Connection to septic system • Pour-flush latrine • Simple pit latrine • Ventilated improved pit latrine World Health Organization