Download
1 / 59
590 likes | 723 Vues
This project focuses on improving environmental performance in Indiana's auto salvage facilities through a multi-agency approach. Utilizing existing tools and resources, the initiative aims to establish a prototype model for regulatory activities that is both transparent and transferable. Key phases include compliance assistance, inspections, and enforcement. By developing a comprehensive database, providing workshops, and fostering partnerships, the project addresses diverse environmental challenges within the sector, ultimately promoting sustainable practices and regulatory compliance.

E N D
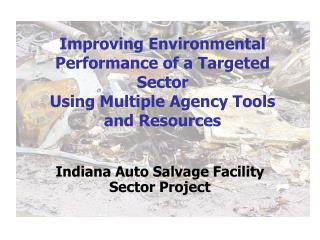
Improving Environmental Performance of a Targeted Sector Using Multiple Agency Tools and Resources Indiana Auto Salvage Facility Sector Project
SUMMARY • - using what we had • - taking advantage of opportunities • - to improve the environment (one sector at a time)
Project History • Available Grant • Decision to use grant to develop a prototype model for sector based activities • Prototype model was to be a continuum, beginning with universe identification and ending with environmental indicators • Project model needed to be “transparent” and “transferable”
Project History The auto salvage industry was chosen to be the first focus sector.
Sector Choice Why Auto Salvage
Choosing the Sector a known problem - nature of complaints • - large number • - received by various programs within agency • - diverse environmental issues • - varied responses • - limited resources • - no easy solution • - “hot” potato
Choosing the Sector • Other Considerations and Concerns • - size of the universe • - available location data • - concerns about facility’s response • - lack of money • - mom & pop organizations • - compliance = huge burden • - no inspection history • - abandonment and bankruptcy • - State left with cleanup
Project DevelopmentThree Major Phases Compliance Assistance Inspections Enforcement
Compliance Assistance • Develop Database and Project Web Site • Develop and Distribute Various Guidance Materials/Compliance Manual • Develop Internal and External Agency Relationships/Partnerships • Provide Workshops
Compliance Assistance • Database development • Web Site www.in.gov/idem/autosalvage • CARS database (Compliance Activity Reporting System) • Incorporated BMV list of ASR sites • Designed to track inspection and enforcement information • Designed to integrate with other internal agency databases
Compliance Assistance • Developed a multi-media compliance manual • Developed in-house through internal agency workgroups • Formatting, graphics within the agency • Printing only was contracted 800 facilities - received a manual with cover letter
Compliance Assistance • Developed posters • Developed mercury removal guides • All developed and designed in-house • With additional pockets of money – OPPTA Continually kept eyes open for additional funds and further opportunities to enhance project
Developed Relationship with: County and State Health Departments Department of Natural Resources Bureau of Motor Vehicles Department of Labor (IOSHA) Department of Revenue County Commissioners Indiana State Police Facility Owners Held 4 regional meetings with potential partners Who we are What we are doing How can they help Compliance Assistance
Compliance Assistance • Conducted 11 Workshops • Speakers within IDEM and from other organizations (BMV, OSHA, ISDH) • Attendees included: • 102 industry • 37 government (non-IDEM) • 25 consultants
Inspections • Develop Targeting Criteria • Select Facilities to Inspect • Develop Inspection Checklist • Select and Train Inspectors
Developing Targeting Criteria 5 Steps: • Obtain Data • Decide on Tools • Spatial Analysis • Scoring • Corroborating list Goal = 50
1. Obtaining Data • Acquiring Data Sources • Bureau of Motor Vehicles tabular list • Referrals internally • Referrals from local law enforcement • County health departments • Preparing the Data • Address matching (when needed) • Preliminary mail-out • Importing data into Access • Adding fields to use for GIS spatial analysis phase
2. Tools • GIS Layers • ArcGIS • Databases • CARS (Compliance Activity Reporting System) • Targeting database • Online tools • Terrafly • Yahoo • Lat/Long Converter
Raster Topographical Map of Indiana High-resolution aerials Sensitive Populations Schools Hospitals Environmental Justice areas Impaired Areas Waste tire sites Impaired Waterways Open Dumping Sites LUST Tools GIS Layers – relative to targeting • Sensitive Areas • Public Water Supplies • Wellhead Protection Areas • Surface Water Intakes • Wetlands • Streams • Exceptional Use Areas
3. Spatial Analysis Choosing Criteria Primary Consideration: Public Health • Focus on urban areas • Schools with public water supplies • Surface water intakes • Proximity to public water supplies
Spatial Analysis Analysis Starting Point:All registered facilities • Approx. 1,100 facilities
Spatial Analysis Analysis Schools & PWS wells • Objective: Select facilities within 1,000 ft from schools within 1,000 ft of a PWS well • Layer(s): Analysis was non-graphical; worked with schools layer and PWS wells layers. • Result: 4 “hits”
Spatial Analysis Analysis Wellhead Protection Areas • Objective: Select facilities within 5-year TOT for WHP areas and/or within 3,000 feet from WHP areas • Layer(s): 5-year TOT, merged with 3,000ft bufferon WHP point data • Result: 68 “hits”
Spatial Analysis Analysis Surface water intake within 3,000ft. • Objective: Select facilities within 3,000 ft of a major surface water intake • Layer(s): Analysis was non-graphical; illustrating 3,000 ft buffer applied to surface water intake layer • Result: 9 “hits”
Spatial Analysis (cont.)Analysis “Hits” • 85 GIS targeted facilities Criteria • Surface water intake; 3,000ft. • Wellhead Protection Areas; 3,000ft / 5-yr TOT • Schools & PWS wells; 1,000 ft
85 Facilities 55 Facilities 5. Corroborating list START • More "Lookin' for a Fender" phone calls • Some facilities no longer in business • Some not salvage yards • Checking with local officials • 10 more facilities added by referral • Some facilities removed from list • Flyovers • Two removed, two added END
Result of Targeting • 17/55 or 31% Based on inspector, town, or local law enforcement referrals • 36/55 or 65% Based on geospatial proximity to sensitive areas • 2/55 or 3.6% added after spotting during flyover
Flyovers • Computer generated tools very useful, however flyovers gave “real time” view of the situation and provided the final information to complete targeting • Identified EPA (integrated strategies) grant • Worked with State Police
Flyovers Why? • Use during possible legal proceedings • Visual confirmation • Establish geographical extent • Get idea of general “ugliness” of facility • Identify gross areas of contamination • Visually confirm whether or not area was adjacent to a waterway
Develop Inspection Checklist • Worked with sister agencies and EPA to develop a truly comprehensive multi-media compliance checklist • Evolved with use • Includes: air, water, solid waste, hazardous waste, OPPTA, BMV, DNR, OSHA, State and Local HDs, EPA
Select Inspectors • Commit resources outside of current job duties • Solicit support from other management groups • Commitment and Competency - people will make or break the project
Train Inspectors • Conducted one pilot inspection • Tested inspection checklist • First 4-5 inspections • Cross-trained with EPA Air • Tested inspection checklist • Included all inspectors
Enforcement • Trained enforcement staff • Developed enforcement referral criteria • Created clearinghouse for referrals • All violations handled within one action • Developed cleanup criteria (varied depending on degree and extent) • Stipulated penalties only ($500/wk per order)
Enforcement • Results • Of 48 inspections, 26 were referred to enforcement • 20 of 26 received formal action • Of 48 inspections, 4 in-compliance • Of 48 inspections, 24 received informal action
Enforcement • Results • Of 20 formal actions • 13 site assessments (heavy contamination) • 12 remove visible contamination (minor staining plus 6 inches) • 14 storm water • 11 tire removals • 1 open burning
Enforcement • Of 26 referrals • 11 Final Orders (Agreed Orders) • 1 Referral to AG • 3 Complied/Case Closed