Testing Independence in Contingency Tables: Key Concepts
Learn about contingency tables as two-way frequency tables for testing independence and homogeneity. Understand test statistic, critical values, and P-values. Explore examples and expected frequencies in contingency tables.


Testing Independence in Contingency Tables: Key Concepts
E N D
Presentation Transcript
Section 11-3 Contingency Tables . .
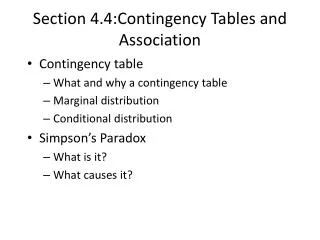
Key Concept In this section we consider contingency tables (or two-way frequency tables), which include frequency counts for categorical data arranged in a table with a least two rows and at least two columns. We present a method for testing the claim that the row and column variables are independent of each other. We will use the same method for a test of homogeneity, whereby we test the claim that different populations have the same proportion of some characteristics. . .
A contingency table (or two-way frequency table) is a table in which frequencies correspond to two variables. (One variable is used to categorize rows, and a second variable is used to categorize columns.) Definition Contingency tables have at least two rows and at least two columns. . .
Test of Independence A test of independence tests the null hypothesis that in a contingency table, the row and column variables are independent. Definition . .
Notation O represents the observed frequency in a cell of a contingency table. E represents the expected frequency in a cell, found by assuming that the row and column variables are independent r represents the number of rows in a contingency table (not including labels). c represents the number of columns in a contingency table (not including labels). . .
Requirements The sample data are randomly selected. The sample data are represented as frequency counts in a two-way table. For every cell in the contingency table, the expected frequency E is at least 5. (There is no requirement that every observed frequency must be at least 5. Also, there is no requirement that the population must have a normal distribution or any other specific distribution.) . .
Null and Alternative Hypotheses H0: The row and column variables are independent. H1: The row and column variables are dependent. . .
Test of Independence Test Statistic • E = 2= • (row total) (column total) (O – E)2 • (grand total) E where O is the observed frequency in a cell and E is the expected frequency found by evaluating . .
Test of Independence Critical Values 1. Found in Table A-4 using degrees of freedom = (r – 1)(c – 1) r is the number of rows and c is the number of columns 2. Tests of Independence are always right-tailed. . .
Test of Independence P-Values P-values are typically provided by computer software, or a range of P-values can be found from Table A-4. . .
Test of Independence This procedure cannot be used to establish a direct cause-and-effect link between variables in question. Dependence means only there is a relationship between the two variables. . .
Expected Frequency for Contingency Tables • row total column total E= • • • grand total • grand total • grand total n • p • (probability of a cell) E= • (row total) (column total) • (grand total) . .
Example: Refer to Table 11-6 and findthe expected frequency for the first cell, where the observed frequency is 88. The first cell lies in the first row (with a total frequency of 178) and the first column (with total frequency of 103). The “grand total” is the sum of all frequencies in the table, which is 207. The expected frequency of the first cell is . .
Example: We know that the first cell has an observed frequency of O = 88 and an expected frequency of E = 88.570. We can interpret the expected value by stating that if we assume that getting an infection is independent of the treatment, then we expect to find that 88.570 of the subjects would be given a placebo and would get an infection. There is a discrepancy between O = 88 and E = 88.570, and such discrepancies are key components of the test statistic. (178)(103) = = 88.570 207 • (row total) (column total) E = • (grand total) . .
Example: Common colds are typically caused by a rhinovirus. In a test of the effectiveness of echinacea, some test subjects were treated with echinacea extracted with 20% ethanol, some were treated with echinacea extracted with 60% ethanol, and others were given a placebo. All of the test subjects were then exposed to rhinovirus. Results are summarized in Table 11-6 (next slide). Use a 0.05 significance level to test the claim that getting an infection (cold) is independent of the treatment group. What does the result indicated about the effectiveness of echinacea as a treatment for colds? . .
Example: Requirements are satisfied: randomly assigned to treatment groups, frequency counts, expected frequencies are all at least 5 H0: Getting an infection is independent of the treatment H1: Getting an infection and the treatment are dependent . .
Example: Significance level is = 0.05. Contingency table: use 2 distribution The critical value of 2 = 5.991 is found from Table A-4 with = 0.05 in the right tail and the number of degrees of freedom given by(r – 1)(c – 1) = (2 – 1)(3 – 1) = 2. . .
Example: . .
Example: Because the test statistic does not fall within the critical region, we fail to reject the null hypothesis of independence between getting an infection and treatment. It appears that getting an infection is independent of the treatment group. This suggests that echinacea is not an effective treatment for colds. . .
Relationships Among Key Components in Test of Independence Figure 11-6 . .
Definition Test of Homogeneity In a test of homogeneity, we test the claim that different populations have the same proportions of some characteristics. . .
How to Distinguish Between a Test of Homogeneity and a Test for Independence: Were predetermined sample sizes used for different populations (test of homogeneity), or was one big sample drawn so both row and column totals were determined randomly (test of independence)? . .
Example: Does a pollster’s gender have an effecton poll responses by men? A U.S. News & World Report article about polls stated:“On sensitive issues, people tend to give ‘acceptable’ rather than honest responses;their answers may depend on the gender or race of the interviewer.” To support that claim, data were provided for an Eagleton Institute poll in whichsurveyed men were asked if they agreed with this statement: “Abortion is aprivate matter that should be left to the woman to decide without government intervention.” . .
Example: We will analyze the effect of gender on male survey subjects only. Table 11-8 is based on the responses of surveyed men. Assume thatthe survey was designed so that male interviewers were instructed to obtain800 responses from male subjects, and female interviewers were instructed toobtain 400 responses from male subjects. Using a 0.05 significance level, test the claim that the proportions of agree/disagree responses are the same for the subjects interviewed by men and the subjects interviewed by women. . .
Example: . .
Example: Requirements are satisfied: data are random, frequency counts in a two-way table, expected frequencies are all at least 5 Test for homogeneity. H0: The proportions of agree/disagree responses are the same for the subjects interviewed by men and the subjects interviewed by women. H1: The proportions are different. . .
Example: Significance level is a = 0.05. This time we’ll use MINITAB. . .
Example: The Minitab display shows the expected frequencies of 578.67, 289.33, 221.33, and 110.67. It also includes the test statistic of2 = 6.529 and the P-value of 0.011. Using the P-value approach to hypothesis testing, we reject the null hypothesis of equal (homogeneous) proportions (because the P-value of 0.011 is less than 0.05). There is sufficient evidence to warrant rejection of the claim that the proportions are the same. . .
Example: It appears that response and the gender of the interviewer are dependent. Although this statistical analysis cannot be used to justify any statement about causality, it does appear that men are influenced by the gender of the interviewer. . .
Fisher Exact Test The procedures for testing hypotheses with contingency tables with two rows and two columns (2 2) have the requirement that every cell must have an expected frequency of at least 5. This requirement is necessary for the 2 distribution to be a suitable approximation to the exact distribution of the test statistic. . .
Fisher Exact Test The Fisher exact test is often used for a 2 2 contingency table with one or more expected frequencies that are below 5. The Fisher exact test provides an exactP-value and does not require an approximation technique. Because the calculations are quite complex, it’s a good idea to use computer software when using the Fisher exact test. STATDISK and Minitab both have the ability to perform the Fisher exact test. . .
Recap In this section we have discussed: • Contingency tables where categorical data is arranged in a table with a least two rows and at least two columns. • Test of Independence tests the claim that the row and column variables are independent of each other. • Test of Homogeneity tests the claim that different populations have the same proportion of some characteristics. • Fisher Exact Test . .