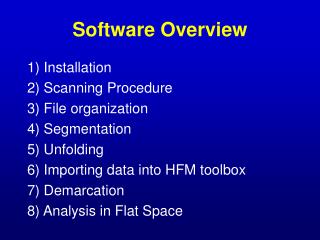
PGA309EVM Software Overview
PGA309EVM Software Overview. Oct 5, 2010. Set up Calibration. Start here to prepare an auto-calibration. Press “Create Model File”. This is the utility for creating the model. Step 1:


PGA309EVM Software Overview
E N D
Presentation Transcript
PGA309EVM Software Overview Oct 5, 2010
Set up Calibration
Start here to prepare an auto-calibration. Press “Create Model File”
This is the utility for creating the model. Step 1: Press “Create Pre Cal File” to create a new pre-cal file. Or press “Select Pre Cal File” to select an existing file.
Create Pre-Cal File
This is the utility for creating a “Pre-Cal File”. The pre-cal file defines initial states of registers, calibration targets, and modes of operation.
Step 1: Enter the power supply voltage. Step 2: Select the reference. Step 3: Select Vexc.
Step 9a: Enter the number of temperature and the polynomial order. Typically the polynomial order is: Poly Order = Numb_Temperatures - 1 Step 9b: Enter the temperatures that data will be measured at.
Select the Output Mode: Vout (4-Wire) –The four wires are: Vout, Vs, GND, and PRG. Vout (3-Wire) – The three wires are: Vout/PRG, Vs, and Gnd. In this mode Vout is connected to PRG. Iout – The connections are: Iout, PRG, GND, and Iret.
This is the configure temperature utility. Press Configure Temperature to set up the PGA309 on board temperature sensor.
For best accuracy select 15b. The only reason to select resolutions less then 15b is for faster temperature measurement capability. Typically 15b is used. The temperature sensor reference selection is determined by system configuration. Vref = Diode temperature measurement Vexc = Rt temperature measurement Vsa = ratiometric
External = diode or Rt type external temperature sensors. Internal = build in to PGA309 internal temperature sensor. Gain is used for small temperature signals. The Rt method typically has small signals and can use high gain (8). The diode method typically does not need gain.
TEMPin, GNDa = Diode, Rt- Vexc, TEMPin = Rt+ Vout, GNDa, = special mode to measure Vout. Vref, TEMPin = ratiometric. For most applications select “continuous conversion mode”
Typical Voltage Output Setup Select the full scale and zero scale output range for the sensor module. Select the full scale and zero scale output range for the sensor module.
Typical Current Output Setup Enter the resistors used in your design. The values shown are the default values installed on the EVM. Output range in amps.
Selecting “Calibrate Nonlinearity” will some additional measurements into the auto-calibration sequence. The output will be measured at 50% to determine nonlinearity vs applied stimulus (e.g. pressure). If your sensor does not require linearity correction, you can leave this unchecked to save calibraiton time.
Press “Select Pre Cal File” to choose the file that will be used during auto-calibration.
Create Sensor Emulator File
Step 1: Press “Create Sensor Emulator File” to create a new sensor emulator file. Or press “Select Sensor Emulator File” to select an existing file.
This is the create sensor file utility. Step 1: Select the method for creating the bridge sensor characteristics. The most common method is to “Enter Raw Data”. Step 2: Select the method for creating the temperature sensor characteristics. Diode and Rt are common.
Step 3: Enter the temperature range and press “ok”. When you do this additional tabs will show up. You will fill out the additional tabs to finish the sensor model.
Step 3: After pressing the “Enter Temperature Range” button additional tabs appear.
You will define the bridge sensor characteristics here. Step 1: Select the format of the data you will enter. Ration is mV/V, and absolute is mV. Step 2: Select the number of different temperature points that the data is measured at. Select the order of the polynomial curve fit. Typically the polynomial order is: Poly_Order = Numb_Points - 1
Step 3: Enter the date over temperature. Note that 1 = 1mV. Make sure the temperature range is inside the range defined above.
Step 4: This step computes the nonlinearity vs. applied stimulus for the function. This can be measured data from any temperature. Idealy the mid scale is: Ideal_Mid_Scale = (Full_Scale + Offset) / 2 Nonlinearity is the deviation from this ideal value.
Step 5: This generates the function. The graph will update.
You will define the temperature sensor characteristics here. The diode temperature function can be created by pressing the “Gen Diode Function” button. The typical values from step 1 do not need to be changed.
Save your sensor results here. Inspect the graphs and press save.
Press “Select Sensor Emulator File” to choose the file that will be used during auto-calibration.
Enter other Model Info
Enter general comments to document this setup here. Press “Enter Model Name” to add a model name. The model name will be used in the automatically generated EEPROM file name. Press “Change Serial No” to enter a starting serial number. The serial number will be automatically incremented each time a device is calibrated. The serial number will be used in the automatically generated EEPROM file name. Press “Enter Model Number” to add a model number. The model number will be used in the automatically generated EEPROM file name.
EEPROM File Name Composition Model Name Model Number Serial Number Date Code Week = 40 Year = 10 (2010)
Run Auto-Cal
This tab is used to run auto-calibration. Press Start to begin the auto-calibration.
This area shows the state the calibration system must be in before pressing continue. Note that the sensor emulator will automatically adjust pressure and temperature stimulus. When using a real world sensor, however, you must adjust pressure and temperature according to the instructions. Press “Continue” to start the first measurement in the calibration.
After pressing continue the first step in the calibration starts. The indicator will blink to let you know that the step is active. Also bar below will let you know the measurements progress.
Continue to step through the test as prompted by the text area. Note the sensor output values are back calculated during the calibration. The sensor results should be close to the emulator output.
At this point in the calibration the nonlinearity calibration is done.
At this point in the calibration the entire initial calibration is complete. The initial calibration includes additional steps that are not required for the subsequent calibrations. In this example, this calibration was done at 0C (emulated temperature).
Continue to step through the test as prompted by the text area. At this point the 0C and 50C calibrations are complete
Continue to step through the test as prompted by the text area. At this point the all of the calibrations are complete. Press continue to write the EEPROM and finish the calibration.
After the calibration is complete, the calibration controls will disable. Note the post calibration results are displayed. Error should be less then 0.1%.
Run Sensor Emulator
Block Diagram tab. After the calibration you can test the post calibration accuracy using the sensor emulator.
This is the sensor emulator utility The green curser lines show the initial state of the emulator.
The ideal output, measured output, and error is displayed here.