Download
1 / 22
220 likes | 384 Vues
IIDS Vision: To help develop a Socially Inclusive Society in its Economy, Polity, Governance and Development. MDGs, Poverty and Malnutrition: Role of ‘Social Belonging’. Nidhi S Sabharwal Director, Indian Institute of Dalit Studies (IIDS), New Delhi

E N D
IIDS Vision: To help develop a Socially Inclusive Society in its Economy, Polity, Governance and Development MDGs, Poverty and Malnutrition:Role of ‘Social Belonging’ Nidhi S Sabharwal Director, Indian Institute of Dalit Studies (IIDS), New Delhi Panel Discussion: Impact and the Global South Human Rights and Economic Justice Essential Elements of the Post-MDG Agenda October 18-20, 2013, Yale University
Poverty & Malnutrition in India, 1993-2010 • Between 1993 and 2010, the incidence of poverty in India declined across social & economic groups. • In absolute terms, growth has been pro-poor (Martin Ravallion) • However, decline was lower for SCs, STs and wage-labour
Human Development Indicators/MDGs for SC, ST • Similarly, the rate of improvement for the SCs and the STs has been lower than the rest of the population for: • Infant Mortality Rates, Child Mortality Rates and U5MR • Full immunization • Maternal Health Indicators: Ante-Natal Care, Birth in a health facility, Birth attended by a skilled personnel and Post Natal care • Proportion of houses in rural areas having no drinking water facility, • Proportion of houses in rural areas having no latrine facility • Proportion of houses in rural areas having open, katcha (make-shift) and no drainage arrangements • Literacy rates: the gap is reducing. The improvement in literacy rates for the SCs and the STs is more than for others. • - Drop-out rates continue to be high.
Why Poverty is high amongst the excluded groups and persists? • Common (group-wide) factors of poverty and deprivation: • Landlessness; Poor access to capital • Unemployment; Low levels of education & skill • Poor health status • Under-representation in governance • However, poor are not uniformly disadvantaged. In case of the discriminated groups, there are ‘Group-Specific’ factors of poverty and deprivation that relates to denial of equal rights and entitlement. • E.g., Denial of equal rights and entitlement due to caste based discrimination and notion of untouchability, manifests itself in the following forms: • Complete exclusion relates to complete denial of opportunities,, • ‘Differential Inclusion’ on differential terms and conditions on rights and entitlement. • ‘Differential Behavior’ related to ‘dignity’ and ‘humiliation’ Indian Institute of Dalit Studies (IIDS)
Studies on ‘Exclusion-Induced’ Deprivation Evidence on market and non-market discrimination associated with caste and untouchability faced by the ‘Scheduled Castes’ • Discrimination in Market Transactions: • Farmers • Non-farm producers • Labor: rural and urban • Rental Market • Discrimination in Non-Market Transactions: • Education • Health • Anti-Poverty Programs
Research Methods • A combination of qualitative & quantitative research techniques are employed to collect data on forms and processes pertaining to discrimination. • Discrimination as a practice is deeply embedded within social relations, so it is crucial to adopt techniques for information collection that captures the forms, processes and consequences. • Quantitative methods through household questionnaires and questionnaires for service providers: Questionnaire that captures access and various forms. • Qualitative methods through Focus Group discussions, Case Studies, Observation method which captures the process and consequence. Indian Institute of Dalit Studies (IIDS)
Discrimination in Market Transactions: Farmers • Input market: Restrictions faced by the Scheduled Caste cultivators in access to services of human or bullock labor; Agricultural implements (tractor); Manure; Irrigation. • High-caste persons regard it as below their dignity to work for wages in the fields of low-caste landowners, or to provide them the services of their bullocks and implements/ tractors. • Water for irrigation not available on time. • Agricultural produce of SC farmers is considered to be ‘polluted’ by the upper castes (due to notion of ‘untouchability’). • Limited market access for SC farmers, especially within their own village • SC farmers rely mostly on the local agents or markets outside the village, where their identity is not known, • Often, SC sellers are dependent on members of their own caste as consumers • Result: adds to their transportation and labor costs, reducing net income. Thorat, Mahamallik, Sadana (2010), Caste and Rural Market, in Sukhadeo Thorat and Katherine S. Newman (eds), Blocked by Caste: Economic Discrimination in Modern India, OUP
NSSO Farmer Study – Differences in Farm Income • Controlling for the technological aspect of farming: • SC households had the lowest average net income per hectare of Rs. 12,906 while Upper Caste households had higher average net income per hectare of Rs. 15,547 (20.5 percent higher than the SC households). • Lesser access to farm technology explained 63 per cent of the fact that the SC farmers have a lower net income per hectare as compared to upper caste households. • The remaining 37 per cent remains unexplained; can be attributed to discrimination – ‘discrimination induced loss of net income per hectare’ as compared to upper caste households (Rs. 974 out of Rs. 2,641). Thorat and Sabharwal (2013), Agricultural Productivity in India: Does Caste Matter? FAO and IIDS Report Indian Institute of Dalit Studies (IIDS)
Caste and Labor Market • Discrimination in hiring, wages and terms & conditions of employment • Exclusion in agricultural operations – harvesting of fruits and vegetables • Exclusion in non-farm work – house construction, social ceremonies, restaurants • Exclusion of Untouchables is in various types of household work • Low participation of SC cooks and helpers in Mid-Day Meal government programas compared to HC • Gap in employment days: Average employment for wage labour: 108 days; for SC: 100 days; for high-caste: 154 days. • Gap in wage rates: Average wage was about Rs.33 per day. The wage received by SC Rs. 30 as compared with Rs 34 per day for HC casual labour. Thorat, Mahamallik, Sadana (2010), Caste and Rural Market, in Sukhadeo Thorat and Katherine S. Newman (eds), Blocked by Caste: Economic Discrimination in Modern India, OUP Indian Institute of Dalit Studies (IIDS)
Urban Labor Market Discrimination • Matched Resume Audit Study: 4,808 applications made to answer 548 job advertisements over 66 weeks. • Applicants with an SC name were on average significantly less likely to have a positive application outcome than equivalently qualified applicants with a higher caste name. • Appropriately qualified applicant with an SC name had odds of a positive outcome that were 0.67 of the odds of an equivalently qualified applicant with a higher caste name. (Thorat and Newman: Blocked by Caste, 2010, Oxford University Press)
Study of experiences of SC children in School UNICEF&IIDS Study (2010) Image source: Thorat and Sabharwal 'Untouchable' in the classroom, The Globe and Mail, Published Monday, Dec. 05 2011
Access to Mid-Day Meal Program in Schools • High participation rate to Mid-Day Meal Program ‘Unfair Inclusion’: • Insufficient quantities of food • Separate seating arrangement for Dalit children during meals • Dalit or low-caste children are served from ‘contact-safe’ distance, • SC children required to bring plates from home, while others are not • Higher caste children get food served first • Being punished for asking to be served first • Serving on plates made of leaves, and, • Dalit children not given responsibility to serve food • Even for identical groups: Likelihood of SC children being malnourished 1.4 times that of children from the GC(when controlled for income, education of the mother, health services etc.) Dreze and Goyal (2003), Thorat and Lee, 2010; Sabharwal and Diwakar, 2012 Thorat and Sabharwal (2012): India Health Beat-PHFI and World Bank Indian Institute of Dalit Studies (IIDS)
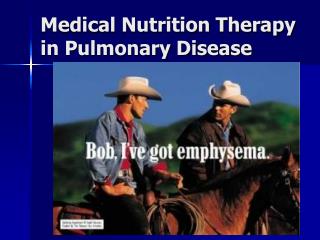
Maternal Health: Pre-Natal, Child Birth and Post-Natal Care • Health care-workers are often from a ‘higher caste’; visit SC houses less frequently • Avoid calling for the monthly meeting/ health and nutrition days • ANMs drop IFA tablets into the hands of SCs from a distance • Avoid touching the SC children during weighing and immunization • Clean the child themselves as the service providers refused to touch the child • Lack of transport at the time of birth to reach health facility as compared to the rest. Indian Institute of Dalit Studies (IIDS)
Maternal Health continued… • A higher proportion of birth at home without trained attendant than the rest; Dependence on Private care; Out-of-pocket expenses to give birth in a health facility were higher for SC mothers (Rs. 1555) as compared to Higher Caste mothers (Rs. 1309): IIDS Study of 7 states, All India Dalit Women Movement, Dalit Women Speak-Out, 2007 • There are differences in the longevity as measured by ‘Age at death’. The average age of death of dalit women, at 39.5 yrs, was nearly fifteen years less than that of non-SC/ST women (Borooha, Sabharwal, Thorat, 2010)
Exclusion-Induced Deprivation • Thus, evidence on market and non-market discrimination associated with caste and untouchability faced by ‘Scheduled Castes’ • negatively affected transactional outcomes for excluded groups in the markets for goods & services and, • in ‘non-market’ transactions (mainly, public services), the excluded groups also fared poorly on account of ‘treatment’ from service providers that kept them from receiving a ‘fair’ level of service. • Parents from the scheduled caste group indicated that discriminatory treatment at school affects children’s food intake & ‘dignity’; they felt ‘humiliated’, lost interest in studies and in school itself. • Forms of discrimination vary across transactional areas/spheres; not uniform.
Policy Approach • Exclusion-Induced Deprivation: Reason for slower improvements in human development amongst the excluded group and continuing disparities. Policy Recommendations: • A combination of anti-poverty policies and affirmative action policies to safeguard against discrimination and for ensuring equitable access to market and non-market institutions.
Research Impact on Policies • Inputs to the 11th and 12th National Plan document, which focused on “Inclusive Growth”, with regards to the approach for excluded groups • New regulations in education that prohibit discrimination (2012); 7000 Universities, 40,000 colleges and lakhs of schools • Sensitizing & training of teachers through modules and workshops; • Administrative guidelines to Village Councils that monitor anti-poverty programs • Prohibition of Employment of Manual Scavenging Act, 2012 • Strengthening SC Sub-Plan and Tribal Sub Plan in the education sector • Affirmative Action Program developed by the Private Sector
Strategies of the UN & International Organizations • Department For International Development, U.K. • DFID’s policy on Poverty and Social Exclusion • Implementation of a large civil society program for poorest regions with a focus on excluded communities. • GOI–FAO Country Programme Framework (2013–17) for agriculture and rural development to includes commitment on: • ‘developing strategies for better access to input and output markets for the small and marginal farmers from disadvantaged groups’(p9); and • ‘mainstreaming disaggregation of data on caste-based parameters into programming, monitoring, evaluation and reportage across all verticals of support to rural production and development activities’ (p9). • UNDP: IIDS’ research for UNDP on ‘Socially Inclusive Growth’ has helped to develop strategy in funding the Government of India’s policies on pro-poor growth. • World Bank Country Policy: The research work on malnutrition has been accepted by the World Bank to be placed on their website and kept for wider circulation. • MDGs Post-2015 replacement efforts: Recommend Combination of Universal & Affirmative Action Policies, Non-Discrimination a ‘Right’so that ‘No one is left behind’ from achieving full human development with dignity.
Challenges • Under-researched area in Social Sciences in India • Limited existing theoretical, conceptual frameworks and methodologies to draw from, hence, it takes time. • Require large sample-size in field-based studies to unpack economic & social relations and processes. • Research-to-Policy influence/ impact is a long process • At times is very difficult; Some consensus on ‘forms’ of discrimination, but disagreement on ‘extent’ and ‘reasons’ or ‘outcomes’
But… • To evolve a fairer economic and social outcome for all, we need to ensure that the knowledge generated reaches the decision-makers and other relevant stakeholders. • The challenge calls for continuous engagement ….. And we choose to never give up! Thank you!