Download
1 / 15
150 likes | 178 Vues
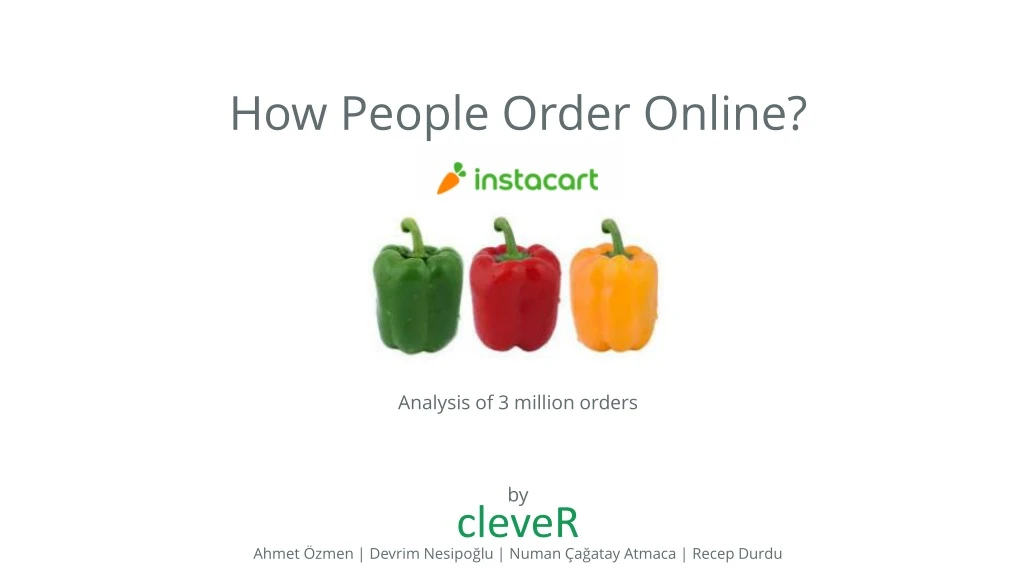
Explore Instacart's data on grocery orders to uncover key findings and trends. Discover popular products, order patterns, and basket analysis using the Apriori Algorithm.

E N D
How People Order Online? Analysis of 3 million orders by cleveR Ahmet Özmen | Devrim Nesipoğlu | Numan Çağatay Atmaca | Recep Durdu
We will talk about… Brief information about Instacart Information about the data we have examined Exploratory analysis of online orders& Key Findings Basket Analysis with Apriori Algorithm
About the Company San Francisco based online shopping website that provide service for online grocery shopping orders and same-day delivery service from various local stores. Instacart has founded in San Francisco on June 2012 and operating in 39 states across United States of America today.
About the Data This dataset contains a sample of over 3 million grocery orders from more than 200,000 Instacart users. For each user, min 4 and max 100 of their orders are provided, with the sequence of products purchased in each order. Products | Aisles | Departments | Order Day of Week | Order Hour | Add to Cart order | Reorder Info
Exploratory Data Analysis 63 % of the sales are come from 4 departments ! Produceand dairy eggs are obvious leaders in sales quantity. Produce department contain products such as vegetable and fruit in the form of fresh or packaged whereas dairy eggs contain yogurt, packaged cheese, milk and eggs, etc.
Exploratory Data Analysis Fresh vegetables and fruits aisles take the lead in sales quantity by far.
Exploratory Data Analysis Bananas are the most ordered products followed by Bag of Organic Bananas and Organic Strawberries.
Exploratory Data Analysis Most orders come during daytime, from 7 am to 7 pm, which is not very surprising. Customersorder at weekends more.
Exploratory Data Analysis People mostly add to cart less than 10 items when they order.
Exploratory Data Analysis Emergency contraceptive, Rethab Energy Iced Tea and California Champaigne around 80% of time added the cart first when they were bought.
Exploratory Data Analysis People tend to order more in 7 or less days after their prior order
Exploratory Data Analysis Peopletend toadd more products to basket as days since prior order increase.
Basket Analysis Apriori Algorithm Atechnique to uncover how items are associated to each other. Support. This says how popular an itemset is, as measured by the proportion of transactions in which an itemset appears. Confidence. This says how likely item Y is purchased when item X is purchased, expressed as {X -> Y} Lift. This says how likely item Y is purchased when item X is purchased, while controlling for how popular item Y is
Basket Analysis • Fresh fruit (24) and fresh vegatables (83) are sold together most frequently (1mn times) • When packaged fresh fruits(123) are purchased, fresh fruit(24) likely to be purchased 73%. • Chips pretzels(107)and fresh fruits(24)added to cart least frequently. • When milk(84) are purchased, fresh vegatables (24) likely to be purchased 51%. In other words if milk aisles are purchased, fresh vegatables aren’t added cart 49%.
Basket Analysis • Fresh fruits prefered mostly with other aisles of products as fresh vegatables do. Graph For 10 Rules • Not surprisingly strongest relations are between Fresh Fruit, Fresh Vegetables and Packaged Vegetables and Fruit. • Fresh Fruit and Fresh Vegetables are purchased with also yogurt, soy lactosefree, bread and cereal See full report: https://mef-bda503.github.io/gpj-clever/BDA503%20Project.html