Download
1 / 18
180 likes | 269 Vues
North America in the Global Carbon Cycle. What is the role of North America in the emissions of fossil fuel CO 2 ? What will future trends be?

E N D
North America in the Global Carbon Cycle • What is the role of North America in the emissions of fossil fuel CO2? What will future trends be? • What is the role of North American vegetation in the global carbon cycle? Why do we think there is a vegetation sink, and what may the course be in the future? • How can we understand and monitor North American sources and sinks of CO2 and CH4?
Antarctic Ice Core Data The heavier temperature lines 160,000 BP to present reflect more data points for this time period, not necessarily greater temperature variability. Climate and Atmospheric History of the past 420,000 years from the Vostok Ice Core, Antarctica, by Petit J.R., Jouzel J., Raynaud D., Barkov N.I., Barnola J.M., Basile I., Bender M., Chappellaz J., Davis J. Delaygue G., Delmotte M. Kotlyakov V.M., Legrand M., Lipenkov V.M., Lorius C., Pépin L., Ritz C., Saltzman E., Stievenard M., Nature, 3 June 1999.
Global Fuel Use 7800 in 2005! 6500 1990 1980 1970 3800 Historical consumption of fossil fuels. Emissions have increased by 2X since 1970, but there has not been a corresponding rise in the annual increment of CO2. In 1970 ~75% of the emitted CO2 stayed in the atmosphere, but only ~40% in 2000. 1960 1950 Year
RECENT GROWTH IN ATMOSPHERIC CO2 CONCENTRATIONS Year-to-year change in CO2 (ppm) (SPO+MLO)/2 3.0 2.5 2.0 1.5 1.0 0.5 0.0 60 62 64 66 68 70 72 74 76 78 80 82 84 86 88 90 92 94 96 98 00 02 The average annual increase did not change much between 1970 and 2000, despite significant increases in fossil fuel emissions. Starting year 0.8 0.6 CO2 Airborne Fraction Average rate of increase per year, 1.5 ppm = 3.25 x 10⁹ tons/yr—little change (some variations) since 1975, but possibly starting to rise by 2005. 0.4 0.2 0.0 60 62 64 66 68 70 72 74 76 78 80 82 84 86 88 90 92 94 96 98 00 Starting year
Changes in oxygen track the role of the land vegetation vs. ocean uptake ofanthropogenic CO2. Land uptake may have decreased at the end of the 1990s, after having increased in the early 1990s. (Manning and Keeling et al., 2006)
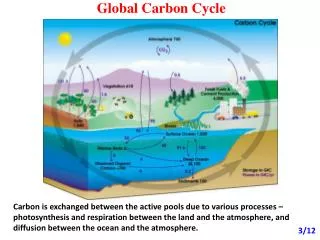
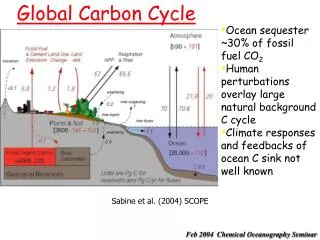
Global CO2 budget (PgC yr-1 ) 1980 – 1990 1990 – 2000 6.5 .5-1 7-7.5 Sources 3.2 1.5-2 1.8-2.8 7-7.5 Sinks 2.1 Pg C = 1 ppm atmospheric CO2[source: Cias et al., Science 269, 1098, (1995)] • Is this budget accurate? What is the scientific basis for these numbers? • Why should mid-latitude terrestrial plants absorb anthropogenic CO2? When did this uptake begin, can/will it continue? • What are the implications of terrestrial uptake for Future CO2? US policy? Climate change?
Atmospheric release of CO2 from burning of fossil fuels will likely give rise to a marked increase in ocean acidity, as shown in this figure. (upper) Atmospheric CO2 emissions and concentrations, historical (—) and predicted (---), together with changes in ocean pH based on mean chemistry. The emission scenario is based on the mid-range IS92a emission scenario assuming that emissions continue until fossil fuel reserves decline. 10 0.1=25% 100.7 = 5 (!) increase in [H+]. The ocean’s capacity to take up CO2 will diminish with time, as the pH of the ocean declines due to uptake of CO2. The ocean becomes acidified. Uptake of CO2 by chemical dissolution is limited by the rate for exchange between deep ocean water and surface water, and eventually, by acidification of the oceans. Acidification of the ocean is likely to lead to major shifts in marine ecosystems.
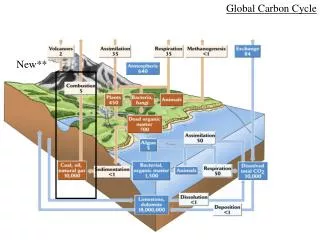
Regional ocean- and land-atmosphere CO2 fluxes, 1992–1996. Orange:Bottom-up land-atm. flux[Pacala, et al., 2001; Kurz and Apps, 1999 N. America; Janssens, et al., 2003, Europe; (Shvidenko and Nilsson, 2003; Fang, et al., 2001, for North Asia]; Cyan:Bottom-up oceanfluxes(Takahashi, et al., 2002), Blue = ocean-atmosphere fluxes, inverse models, Green = land-atmosphere fluxes, inverse models, Magenta = land plus ocean inversion fluxes, Red: fossil fuel emissions, subtracted from net. Source: P. Ciais, 2006
Uptake of CO2 in the US (PgC yr-1) [Pacala et al., 2001] US "forests": Net sink: 0.3-0.6 PgC yr-1 Emissions (1996): US 1.44 Mexico 0.09 Canada 0.11 Forests in the US – and many other places – are in middle to young age classes (25-75 years), due to changes in agriculture (intensification) and forest management (intensification).
A legacy: land use change in New England MA NH % of land area in forests 20 40 60 80 100 Year 1700 1800 1900 2000 Fitzjarrald et al., 2001
NEE = -1.28 - 0.146 x (yr-1990); R2 = 0.337 0 -1 -2 NEE (Mg-Cha-1yr-1) -3 -4 -1 x GEE -5 GEE = 11.1 + 0.363 x (yr-1990); R2 = 0.732 Resp 16 R = 9.82 + 0.217 x (yr-1990); R2 = 0.626 120 oak other spp 14 Mg-C ha-1yr-1 100 12 10 80 1992 1994 1996 1998 2000 2002 2004 Aboveground woody biomass (MgCha-1) 60 Year 40 20 0 93 94 95 96 97 98 99 00 01 02 03 04 05 Year Rates for growth and for carbon uptake are accelerating in this 80-year-old New England Forest…why is that? Will that continue? How big do North American trees grow?
20 30 50 cm Changing climate and C: an example from NOBS flux site, Thompson, MB PEAT 45% cover Snow cover Temperature
Thompson, MB 60 40 20 NEE (kgC/ha/yr) 0 -20 -40 85 90 95 100 105 110 115 P2 (mm/2yr) (gC m-2 yr-1) Uptake | emission r2=.72 p<.0035 slope=-3.5 Precipitation (mm in 2 yr) Net CO2 echange Annual NEP, 1994-2004 -15 0 15 -2 0 2 -50 0 50 T : warmer Annual T anomaly (oC) Water table depth and hydrology are key factors controlling the accumulation or ablation of peat. Precip: wetter Annual Precip Anom (mm) 95 96 97 98 99 00 01 02 03 Year Deviation from the 9-year means of annual Net Ecosystem Exchange (upper, g C m-2 ), temperature (middle, C), and two-year precipitation sums (lower, cm), illustrating the critical role hydrology plays in determining the annual carbon balance at a mature black spruce forest.
Daily respiration, g C m-2 Water table depth, cm Figure 2: interaction of WT depth and CO2 Flux from the boreal peatland in Manitoba, summer 2002
[base yrs: 1951-1980] But wasn't the weather unusually cold in 2002-2003? Not over the globe….
Positive correlation warmer-wetter; or cooler-drier Correlation: {DT, D soil moisture index}CCSM1-Carbon Control Simulation DJF JJA Negative correlation warmer-drier; or cooler-wetter slide courtesy Inez Fung [I. Fung, S. Doney, et al.]]
Summary • The North American Carbon Program will: • measure the large sink for fossil fuel CO2 that appears to be operating in the region • determine why this sink exists, and define the controlling factors (temperature, precipitation, legacies, CO2, nutrients, …) quantitatively. • enable projections of future trajectories • support decision makers in dealing with key global change issues through management and policy options.