The Carbon Cycle
The Carbon Cycle. Introduction: Changes to Global C Cycle (Ch. 15) C-cycle overview: pools & fluxes (Ch. 6) Controls on GPP (Ch. 5) Controls on NPP (Ch. 6) Controls on NEP (Ch. 6).


The Carbon Cycle
E N D
Presentation Transcript
The Carbon Cycle Introduction: Changes to Global C Cycle (Ch. 15) C-cycle overview: pools & fluxes (Ch. 6) Controls on GPP (Ch. 5) Controls on NPP (Ch. 6) Controls on NEP (Ch. 6) Powerpoint modified from Harte & Hungate (http://www2.for.nau.edu/courses/hart/for479/notes.htm) and Chapin (http://www.faculty.uaf.edu/fffsc/)
Rising atmospheric CO2 Schlesinger 1997
Atmospheric CO2 concentration is rising • Significant effects of biospheric uptake/release
Most major greenhouse gases are increasing in atmospheric concentrations 15.3
-CO2 at highest level in past 650,000 yrs. • CO2 increasing faster than any time in past 650,000 yrs • High atmospheric CO2 correlated with warmer climates 15.2
Global C Cycle To understand fates of C and potential remediation, we need to understand the controls on C uptake and loss from ecosystems 15.1
4 major pools Pools in Pg Fluxes in Pg yr-1
Major Global C pools • Atmosphere, land & oceans contribute to cycling over decades-centuries. • Rocks have the largest pool of C, but changes are small on these time scales • Main pools on land are organic C (terrestrial biota & SOM) (~3x atmosphere) • Main pool in oceans is dissolved inorganic C. Aquatic biota are a relatively small pool.
4 major fluxes Photosynthesis, Dissolution Respiration, Combustion Pools in Pg Fluxes in Pg yr-1
Major global C fluxes • Terrestrial systems: fires, het resp roughly balance NPP • Oceans take up ~2 Pg more than they releasedeep storage (biol & solubility pumps) • Humans adding C to atmosphere through fossil fuels & land use change.
Global Carbon Budgeting How much have we released in fossil fuel burning? Where is it all going? Pg C yr-1 Sources: 7.1 ± 1.1 Fossil Fuel Burning 5.5 ± 0.5 Land use change 1.6 ± 1.0 Sinks: 7.1 Atmospheric accumulation 3.2 ± 0.2 Oceanic Uptake 1.6 ± 1.0 The “Missing Sink” 2.3 Oceanic? Terrestrial? Why?
How do we figure this out? • Partitioning terrestrial and oceanic carbon exchange: • a multiple tracer approach • Oxygen • A) Land-atmosphere CO2 exchange is immediately coupled with O2 exchange: photosynthesis produces • O2, respiration consumes it • B) Ocean-atmosphere CO2 exchange is physical dissolution, so oceanic CO2 uptake does not influenceatmospheric O2 • C) Thus, the relationship between the CO2 and O2 • content of the atmosphere provides a fingerprintof terrestrial and oceanic CO2 exchanges
1) We know how much fossilfuels we’re burning (and that combustion requires O2) 3) We know the O2:CO2ratio associated with land-atmosphere CO2 exchange, and can use this to constrainland CO2 uptake 2) But we observeless CO2 increaseand O2 decrease thenwe should based on knownfossil fuel emissions 4) Ocean CO2 uptake, toocan be constrained because we know it’s not associatedwith ocean-atmosphere O2exchange
Partitioning terrestrial and oceanic carbon exchange: a multiple tracer approach • 2) Carbon Isotopes • A) Terrestrial photosynthesis fractionates against 13C • Overall average fractionation currently estimatedat about 18 per mil (‰) – so far, this is a rough global estimate of the combined influences of C3 vs. C4 vs. CAM, water stress, etc. B) Oceanic CO2 uptake involves very small fractionation effects C) Thus, changes in the 13C content of the atmosphere indicate the extent to which concurrent CO2 variations can be ascribed to terrestrial or oceanic activity
Potential Terrestrial C sinks Atmospheric N Deposition Fertilizes Ecosystems, CausingA Large Global Carbon Sink (as much as 1.6 Pg C yr-1) Townsend et al. 1996, Holland et al. 1999
Potential Terrestrial C sinks 2. CO2 fertilization 3. Plant growth from land use change - Afforestation: Previously cultivated lands have been abandoned throughout the temperate zoneand are becoming forests again. - Woody encroachment into deserts and grasslands - Suppression of wildfires - Changing agricultural practices promotes C storage in soils - Wood products are C sinks…
Global Carbon Budgeting How much have we released in fossil fuel burning? Where is it all going? Pg C yr-1 Sources: 7.1 ± 1.1 Fossil Fuel Burning 5.5 ± 0.5 Land use change 1.6 ± 1.0 Sinks: 7.1 Atmospheric accumulation 3.2 ± 0.2 Oceanic Uptake 1.6 ± 1.0 Terrestrial Uptake 2.1 CO2 fertilization 1.0 ± 0.5 Forest Regrowth 0.5 ± 0.5 Nitrogen Deposition 0.6 ± 0.3 Other 0.2 ± 2.0
Long-term behavior of terrestrial sink is unknown • What do we need to know about terrestrial C cycling to understand potential changes?
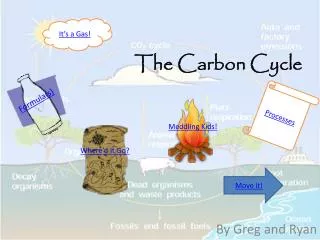
II. C-cycle overview (within-ecosystem C pools and fluxes) • Terms 1. Biomass vs. productivity 2. GPP vs. NPP vs. NEP 3. Secondary production B. C-cycle schematic 1. Simple 2. Complete
Overview of ecosystem carbon cycle Inputs: plant photosynthesis (GPP) Internal cycling: litterfall, herbivory, consumption, mortality Outputs: plant, animal, microbial respiration; volatile emissions (small); leaching (~small); disturbance (fire, harvest) 6.1 Net primary production
Carbon Cycle – The Simple Version CO2 Ps (GPP) R Plants NPP = GPP-Rplant Flat in: migration sediments dissolved C Animals NEP = GPP - Re Flat out: dist., mig., leaching, sed., volatile emissions, CH4 Soils
Primary production • Gross primary production (GPP) = plant photosynthesis • Net primary production (NPP) NPP = GPP – Rplant NPP = DPlant/Dt + Clost Clost: exudates, vol. emissions, herbiv., tissue turnover, disturbance (fire, harvest) • NPP is total energy available to rest of ecosystem • In practice, NPP is hard to measure DPlant/Dt – misses Clost (~30% of total) Some pathways more important than others Difficulties belowground
Primary production • Net ecosystem production (NEP) NEP = GPP – Recosyst (note change from book, see Chapin et al. 2006) Recosyst = Rplant + Rhet NEP = NPP – Rhet NEP = (DPlant + DHet + DSOM)/Dt NECB = NEP +/- Flat (note change from book, see Chapin et al. 2006 NBP = net biome production = NECB at large spatial and temporal scales.(Chapin et al. 2006) • Secondary production = DHet/Dt (see Chap. 11) See Box 6.1 Which of these (GPP, NPP, NEP) is most relevant to long-term sequestration of CO2 from atmosphere?
(-) (+) C-cycle: the somewhat more detailed version
Figure from CMM follows similar pattern with slightly different structure 6.8
Main messages • C flow is linked to energy flow • C cycles, energy flow is one-way • Plant production provides the fuel for the entire ecosystem • GPP>NPP>NEP • GPP, NPP determine how fast C taken up by ecosystem • NEP determines how much C stored by ecosystem per unit time