Download
1 / 20
200 likes | 339 Vues
Modeling the Air Quality Impacts of Climate and Land Use Change in the New York City Metropolitan Area.

E N D
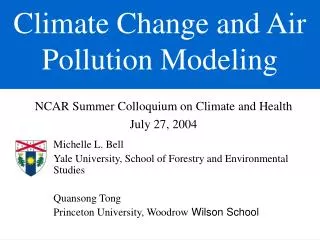
Modeling the Air Quality Impacts of Climate and Land Use Change in the New York City Metropolitan Area C. Hogrefe1, K. Civerolo2, J.-Y. Ku2, B. Lynn3,J. Rosenthal3, K. Knowlton3, B. Solecki4, J. Cox4, C. Small3, S. Gaffin3, R. Goldberg5, C. Rosenzweig5, and P.L. Kinney3 1Atmospheric Sciences Research Center, State University of NY at Albany, 2NYS Dept. of Environmental Conservation,3Columbia University,4Hunter College, 5NASA-Goddard Institute for Space Studies Models-3 Users’ Workshop, October 20, 2004 This project is supported by the U.S. Environmental Protection Agency under STAR grant R-82873301
Changing Greenhouse Gas Emissions IPCC SRES Scenarios Changing Greenhouse Gas Emissions IPCC SRES Scenarios Global Climate NASA-GISS GCM Global Climate NASA-GISS GCM Regional Climate MM5, RAMS Regional Climate MM5, RAMS Public Health Risk Assessment Changing Regional Land Use / Land Cover SLEUTH, Remote Sensing, IPCC SRES Scenarios Changing Regional Land Use / Land Cover SLEUTH, Remote Sensing, IPCC SRES Scenarios Air Quality SMOKE, CMAQ Air Quality SMOKE, CMAQ Changing Ozone Precursor Emissions IPCC SRES Scenarios Changing Ozone Precursor Emissions IPCC SRES Scenarios The New York Climate and Health Project (NYCHP)
GCM/MM5/CMAQ Model Setup • GISS coupled global ocean/atmosphere model driven by IPCC “A2” and “B2” greenhouse gas scenarios • MM5 was run on 2 nested domains of 108km and 36km over the U.S. • Simulations periods : June – August 1993-1997 June – August 2023-2027 June – August 2053-2057 June – August 2083-2087 • 1996 U.S. Emissions processed by SMOKE and – for some simulations - scaled by IPCC scenarios • BEIS2 for biogenic emissions and Mobile5b for mobile source emissions • CMAQ 4.2 was run at 36km to simulate ozone • CB-IV mechanism, no aerosols
Model Setup for LU Change Simulations • Current and future land use scenarios were generated with the SLEUTH/Deltatron model as described by Solecki and Oliveri, J. Env. Manag. 2004 • MM5 and CMAQ were run for a 4 km grid centered over NYC nested inside 108/36/12 km grids • MM5 incorporated simulated changes in land use • Simulations periods : July 5 – July 24, 1993 June 18 – July 4, 2056 • Emission processing and CMAQ configuration identical to previous runs
Overview Model Evaluation (from Hogrefe et al., Atmos. Env., 2004) • The GCM/MM5/CMAQ system captures synoptic-scale and interannual variability of summertime temperatures and ozone in the current climate • Patterns of observed and predicted summertime average daily maximum ozone concentrations showed a correlation of 0.68, a bias less than 1 ppb and a mean gross error of 6 ppb • Good agreement for the medium and high end between observed and predicted space-time cumulative distribution functions • Good representation of the frequency and duration of extreme ozone events.
Future-Year Simulations • Impact of climate change only • Impact of climate change, changes in emissions, and changes in chemical boundary conditions • Impact of changes in land use in the greater New York City metropolitan area
1990s Average 2020s Change 2050s Change 2080s Change Summertime Average Daily Maximum 8-hr Ozone Changes for Multiple “Decades” (2020s, 2050s, 2080s) in the A2 Scenario (from Hogrefe et al., JGR, 2004, in press) • CMAQ predicts an increase in average summertime daily maximum 8-hr ozone concentrations for future decades as a result of climate change alone for the A2 greenhouse gas scenario
Change in the Frequency and Duration of Extreme Ozone Events For Different IPCC-SRES Scenarios and “Decades” for the greater NYC Metropolitan Region • CMAQ predicts an increase in the frequency and duration of extreme ozone concentrations for future decades as a result of climate change alone for the A2 and B2 greenhouse gas scenarios over the NYC metropolitan region
1990s 4th Highest Climate Effect Emission Effect Boundary Effect Effects of Changes in Climate (A2), Anthropogenic Emissions, and Boundary Conditions on the 4th-Highest Daily Maximum 8-hr Ozone Concentration for the 2050s (from Hogrefe et al., JGR, 2004, in press)
Changes in Average Concentrations vs. Changes in Extreme Concentrations for the Greater NYC Metropolitan Area Average 4th Highest Ozone Increase (ppb) • Changes in regional climate outweigh the effects of increased boundary conditions and increased anthropogenic emissions over the greater New York City metropolitan area when changes in the 4th-highest summertime daily maximum 8-hr O3 concentration are considered
Land use categories in the greater New York City metropolitan area as simulated by Solecki and Oliveri (2004) for the 1990s (left) and 2050s A2 scenario (right). Forest (green), Agriculture (yellow), High Density Urban (red), Medium Density Urban (orange), Low Density Urban (pink), and Other (white).
Changes in Episode-Average Daily Maximum Temperature (left) and PBL Height (right) Caused by Incorporating the Changes in Land Use Into a 20-day MM5 Simulation MM5 PBL with 2050s A2 Land Use Minus MM5 PBL with 1990s A2 Land Use for a 1993 Climate Episode MM5 T with 2050s A2 Land Use Minus MM5 T with 1990s A2 Land Use for a 1993 Climate Episode • Changes in average daily maximum temperature and PBL height are always positive and are largely confined to the regions with largest land use change
Changes in Episode-Average Daily Maximum Wind Speed (left) and Cloud Fraction (right) Caused by Incorporating the Changes in Land Use Into a 20-day MM5 Simulation MM5 Speed with 2050s A2 Land Use Minus MM5 Speed with 1990s A2 Land Use for a 1993 Climate Episode MM5 CF with 2050s A2 Land Use Minus MM5 CF with 1990s A2 Land Use for a 1993 Climate Episode
Changes in Episode-Average Daily Maximum O3 Caused by Using the Changed Land Use MM5 Simulations for 20-day CMAQ Simulations in 1993 CMAQ O3 with 2050s A2 LU MM5 Minus CMAQ O3 with 1990s A2 LU MM5 • While most areas exhibit increased episode-maximum O3, some areas show decreases • O3 changes are largely confined to areas of land use and temperature changes
Changes in Episode-Maximum Ozone (in ppb) Caused by Using the Changed Land Use MM5 Simulations for 20-day CMAQ Simulations in 1993 (left) and 2056 A2 (right) CMAQ O3 with 2050s A2 LU MM5 Minus CMAQ O3 with 1990s A2 LU MM5 for a 2056 Climate Episode CMAQ O3 with 2050s A2 LU MM5 Minus CMAQ O3 with 1990s A2 LU MM5 for a 1993 Climate Episode • While most areas exhibit increased episode-maximum O3, some areas show decreases • O3 changes are not confined to areas of land use and temperature changes • Average episode-average O3 change (non-water grid cells) is 1.5 ppb (1993, left) and 1.0 ppb (2056, right)
Summary • CMAQ predicts an increase in average and extreme ozone concentrations for future decades as a result of climate change alone for two greenhouse gas scenarios • Changes in regional climate outweigh the effects of increased boundary conditions and increased anthropogenic emissions over the greater New York City metropolitan area when changes in the 4th-highest summertime daily maximum 8-hr O3 concentration are considered • For the two selected episodes, projected land use change can have local impacts of comparable magnitude as the other factors considered in this study
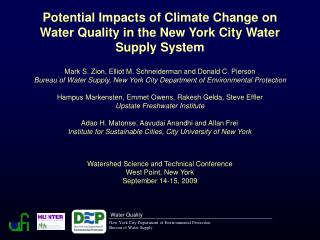
Modeling Domain • 36 km MM5/CMAQ domain and NYCHP 31-county area of interest around New York City • About 400 ozone and temperature monitors in the entire domain • About 20 ozone and temperature monitors in the 31-county area
Changes in Episode-Maximum Temperature (in degrees C) Caused by Incorporating the Changes in Land Use Into a 20-day MM5 Simulation in 1993 (left) and 2056 A2 (right) MM5 T with 2050s A2 Land Use Minus MM5 T with 1990s A2 Land Use for a 2056 A2 Climate Episode MM5 T with 2050s A2 Land Use Minus MM5 T with 1990s A2 Land Use for a 1993 Climate Episode • Temperature change is almost always positive and is largely confined to the regions with largest land use change • Average episode-average temperature change (non-water grid cells) is 0.6 C (1993, left) and 0.7 C (2056, right)