Download
1 / 24
240 likes | 469 Vues
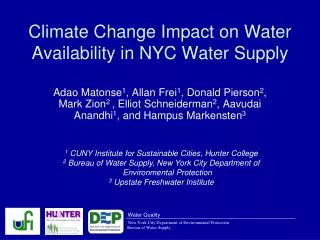
Water Quality. New York City Department of Environmental Protection. Bureau of Water Supply. Potential Impacts of Climate Change on Water Quality in the New York City Water Supply System. Mark S. Zion, Elliot M. Schneiderman and Donald C. Pierson

E N D
Water Quality New York City Department of Environmental Protection Bureau of Water Supply Potential Impacts of Climate Change on Water Quality in the New York City Water Supply System Mark S. Zion, Elliot M. Schneiderman and Donald C. Pierson Bureau of Water Supply, New York City Department of Environmental Protection Hampus Markensten, Emmet Owens, Rakesh Gelda, Steve Effler Upstate Freshwater Institute Adao H. Matonse, Aavudai Anandhi and Allan Frei Institute for Sustainable Cities, City University of New York Watershed Science and Technical Conference West Point, New York September 14-15, 2009
Purpose: To evaluate the potential effects of future climate change on the water quality of New York City Water Supply Turbidity in Schoharie Reservoir Eutrophication in Cannonsville Reservoir Integrated Modeling Strategy Use of an integrated suite of already developed models Preliminary development of tools and measures future water quality Phase I result highlights Preliminary model applications to obtain initial estimates of climate effects NYC DEP Climate Change Integrated Modeling ProjectWater Quality – Phase I
Climate Change Phase I Study Areas • Eutrophication – Focus on Cannonsville Reservoir • Turbidity – Focus on Schoharie Reservoir Location Map NY State NY City
Schoharie Reservoir Turbidity
Climate Change Scenarios Phase I – Schoharie Turbidity Delta Change Method Applied for 7 GCM/Emission Scenarios • GCM/Emission Scenario data obtained from IPCC AR4 (2007) • For each GCM/Emission Scenario, precipitation and air temperature are compared in control vs. future periods to derive monthly delta change factors.
Delta Change Calculate future climate scenarios CEQUAL-W2 Reservoir Model GWLF Watershed Model Pre-Processor Simulate reservoir volume, temperature and constituents in 2 dimensions (vertical, longitudinal) • Calculate turbidity inputs using sediment rating curve • Estimate inflow water temperature • Reformat data for W2 model Simulate streamflow and evaporation OASIS System Model Simulate tunnel operations Phase I - Schoharie Turbidity Modeling System Delta Change, GWLF, OASIS and W2 Models Historical Meteorology Precip Air Temp Air Temp Inflows Turbidity Loads Stream Temp Tunnel Ops PET Streamflows Stream Flow Tunnel Flows Reservoir Water Quality
Average Monthly Values Current Climate 2080-2100 Scenarios Results - Schoharie Input Turbidity Input Flow Reservoir Inflow (cms) Input Turbidity (NTU) In-Lake Turbidity (Segment 7) Segment 7 Turbidity (NTU)
Results - Schoharie Input Turbidity Fraction of Time over 100 NTU Baseline Scenario 2046-2065 Scenarios 2081-2100 Scenarios
Results - Schoharie Segment 7 In-Lake Turbidity Fraction of Time over 100 NTU Baseline Scenario 2046-2065 Scenarios 2081-2100 Scenarios
Results - Schoharie Segment 7 In-Lake Turbidity Fraction of Time over 15 NTU Baseline Scenario 2046-2065 Scenarios 2081-2100 Scenarios
Cannonsville Reservoir Eutrophication
Climate Change Scenarios Phase I – Cannonsville Eutrophication Delta Change Method Applied for 9 GCM/Emission Scenarios • GCM/Emission Scenario data obtained from IPCC AR4 (2007) • For each GCM/Emission Scenario, precipitation and air temperature are compared in control vs. future periods to derive monthly delta change factors.
Delta Change Calculate future climate scenarios Pre-Processor UFI-1D / PROTECH Reservoir Model GWLF Watershed Model • Adjust reservoir water balance based on future inputs • Estimate inflow water temperature • Estimate dew point temperature • Reformat data for W2 model Simulate streamflow, evaporation, nutrient and sediment loads Simulate reservoir volume, temperature, nutrients and phytoplankton functional groups in vertical dimension Phase I - Schoharie Turbidity Modeling System Delta Change, GWLF, UFI-1D/PROTECH Models Historical Meteorology Air Temp Wind Speed PAR Precip Air Temp Inflows Meteorology Nutrient Loads Stream Temp Reservoir Ops PET Streamflows Nutrient Loads Reservoir Water Quality Historical Operations
Scenario Reservoir Chl a Baseline Reservoir Chl a Baseline Loads Streamflow Dissolved P Particulate P Scenario Loads Streamflow Dissolved P Particulate P Example: Strategy to Evaluate Watershed Management Baseline Chl a Frequency Distribution Reservoir Model (calibrated) freq mg/m3 Scenario Chl a Frequency Distribution Reservoir Model (calibrated) ? freq mg/m3
Example: Changes in Mean Annual Chlorophyll Concentration Epilimnion Cannonsville Reservoir Due to MOA Programs Pre - MOA 0.25 Frequency 0.00 5 10 15 20 25 30 Input DP Load Chlorophyll (mg m-3) Pre - MOA Current Climate Post - MOA Post - MOA 0.25 Frequency 0.00 5 10 15 20 25 30 Chlorophyll (mg m-3)
Average Monthly Values Current Climate 2080-2100 Scenarios Results - Cannonsville 2081-2100 Climate Scenarios Reservoir Inflow Reservoir Inflow (cms) Input DP Load Input PP Load PP Load (kg/day) DP Load (kg/day)
Current Climate 0.50 2080-2100 Scenarios 0.25 Frequency Frequency 0.00 0.00 40 0 10 20 30 0 10 20 30 Chl-a Concentration (mg/m3) Water Temperature (C) Average Monthly Values Current Climate 2080-2100 Scenarios 25 14 20 12 15 Water Temperature (C) 10 Chl-a Conc. (mg/m3) 10 8 6 5 4 2 Month Month Results - Cannonsville Epilimnion Water Temperature Epilimnion Chl-a Concentration Daily Histograms
Results - Cannonsville Thermal Stratification Density Difference (Epilimnion – Hypolimnion) Current Climate 2046-2065 2081-2100 Density Difference (kg/m3)
Growing Season Averages Chl-a Total P 0.25 0.30 Pre-MOA 0.00 0.00 0.30 0.25 Current Climate - Post-MOA 0.00 0.00 Frequency Frequency Future Climate: 2046-2065 0.25 0.30 0.00 0.00 0.25 0.30 Future Climate: 2081-2100 0.00 0.00 5 15 20 25 30 0 20 40 60 80 30 5 Chl a (mg/m3) Total P (mg/m3)
Results - Cannonsville Epilimnion Chl-a Concentration Fraction of Time over 15 mg/m3 Future Climate: 2080-2100 Pre-MOA Boxes/whiskers show range of 2081-2100 climate scenarios Post-MOA / Current Climate
Summary of Results • Schoharie Reservoir Turbidity: • Increased fall and early winter flows lead to increase turbidity loading during these time periods. Reduced spring flows lead to reduction in loading during these periods • Turbidity levels in the reservoir at the Shandaken Tunnel gate are increased in fall and early winter, reduced in late winter and unchanged in summer. • Cannonsville Reservoir Eutrophication • Slightly longer period of thermal stratification. • Enhanced phytoplankton blooms due to slightly increased DP loads and thermal stratification changes • Increased phytoplankton much less than magnitude of reductions in algal growth due to watershed management program implementation
Future Work – Phase II • Extend turbidity analysis to Ashokan Reservoir • Implement fully connected OASIS/W2 model • Incorporation of improved watershed turbidity loading models • Extend eutrophication analysis to other Delaware System reservoirs • Implement feedback between OASIS and UFI-1D/PROTECH model results • Improved simulation of watershed biogeochemistry to better reflect climate change effects on nutrient loads
Water Quality New York City Department of Environmental Protection Bureau of Water Supply Potential Impacts of Climate Change on Water Quality in the New York City Water Supply System Mark S. Zion, Elliot M. Schneiderman and Donald C. Pierson Bureau of Water Supply, New York City Department of Environmental Protection Hampus Markensten, Emmet Owens, Rakesh Gelda, Steve Effler Upstate Freshwater Institute Adao H. Matonse, Aavudai Anandhi and Allan Frei Institute for Sustainable Cities, City University of New York Watershed Science and Technical Conference West Point, New York September 14-15, 2009