Sums and Differences of Sinusoids
Sums and Differences of Sinusoids. Sec. 4.6b. Exploration 1: Investigating Sinusoids. Graph these functions, one at a time, in the viewing window. . Which ones appear to be sinusoids?. Only these functions appear to be sinusoids!!!. Exploration 1: Investigating Sinusoids.

Sums and Differences of Sinusoids
E N D
Presentation Transcript
Sums and Differences of Sinusoids Sec. 4.6b
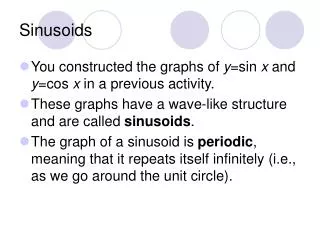
Exploration 1: Investigating Sinusoids Graph these functions, one at a time, in the viewing window . Which ones appear to be sinusoids? Only these functions appear to be sinusoids!!!
Exploration 1: Investigating Sinusoids What relationship between sine and cosine functions ensures that their sum or difference will again be a sinusoid? The rule is simple: Sums and differences of sinusoids with the same period are again sinusoids!!! Definition: A sinusoid is a function that can be written as
Sums That Are Sinusoid Functions If and then is a sinusoid with period Does this rule also work for the sum of two sine functions or the sum of two cosine functions??? Yes indeed!!!
Practice Problems Determine whether each of the following functions is or is not a sinusoid. (a) A sinusoid Both functions in the sum have the same period: (b) Not a sinusoid Period of the first function: Period of the second function:
Practice Problems Determine whether each of the following functions is or is not a sinusoid. (c) Not a sinusoid Period of the first function: Period of the second function: (d) A sinusoid All three functions have the same period:
Practice Problems Let (a) Is f a sinusoid? Yes, both functions have the same period (b) Find the period of f. Period = (c) Estimate the amplitude and phase shift graphically. Graph the function in Calculate the maximum value of f: This is the approximate value of the amplitude!!! Calculate the x-intercept closest to x = 0: This is the approximate phase shift of the sine function!!!
Practice Problems Let (d) Give a sinusoid that approximates Plug in the previously-discovered values: To verify our answer graphically, graph f and g in the same viewing window:
Practice Problems Show that the given function is periodic but not a sinusoid. Graph one full period of the function. Since the two smaller functions have different periods, their sum is not a sinusoid. Let’s check to see if is a period of our function:
Practice Problems Show that the given function is periodic but not a sinusoid. Graph one full period of the function. This proves that either is a period of f or that the period is an exact divisor of . Check the graph in the window Evidence that the period must be !!! What happens if we expand the x-coordinates of our window???
Damped Oscillation Our last topic for Section 4.6
Let’s experiment… Graph in the window In the same window, also graph: What do you notice about these graphs??? The “squeezing” of the first function between the other two is called damping…
Damped Oscillation The graph of (or ) oscillates between the graphs of and . When this reduces the amplitude of the wave, it is called damped oscillation. The factor is called the damping factor.
Identifying Damped Oscillation For each of the following functions, determine if the graph shows damped oscillation. If it does, identify the damping factor and tell where the damping occurs. (a) Graph in Does this graph show damped oscillation? Yes!!! –x 2 What is the damping factor? 8 As x Where does the damping occur? How does this all relate to the graphs of the two smaller functions that comprise f ???
Identifying Damped Oscillation For each of the following functions, determine if the graph shows damped oscillation. If it does, identify the damping factor and tell where the damping occurs. Graph: (b) No damping occurs (c) Graph: Damped oscillation Damping factor: –2x The damping occurs as x 0
A Damped Oscillating Spring A physics class collected data for an air table glider that oscillates between two springs. The class determined from the data that the equation modeled the displacement y of the spring from its original position as a function of time t. (a) Identify the damping factor and tell where the damping occurs. Damping factor: The damping occurs as
More Guided Practice Tell whether the given functions exhibits damped oscillation. If so, identify the damping factor and tell whether the damping occurs as x approaches zero or as x approaches infinity. (a) Damped oscillation, damping factor: The damping occurs as (b) No damping (amplitude is constant) (c) Damped oscillation, damping factor: The damping occurs as
More Guided Practice For each function, graph both f and plus or minus its damping factor in the same viewing window. Describe the behavior of the function f for x > 0. What is the end behavior of f ? (a) Window: The function f oscillates up and down between and End Behavior: (b) Window: The function f oscillates up and down between and End Behavior: