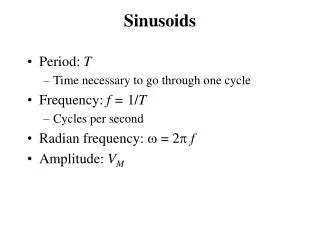
Understanding and Graphing Sinusoids in Simple Harmonic Motion
This guide explores the fundamentals of graphing sinusoids, which represent objects in simple harmonic motion, such as a swinging pendulum. Key concepts include definitions of simple harmonic motion, frequency, amplitude, and period. You'll learn about the sine and cosine functions, their graphical representations, and how to identify key point intervals for accurate graphing. We also provide a step-by-step example to help you find the period, amplitude, and other essential elements needed to graph a sinusoid successfully.


Understanding and Graphing Sinusoids in Simple Harmonic Motion
E N D
Presentation Transcript
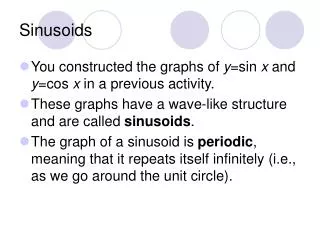
Sinusoids • Sinusoid graphs are used to represent objects that have simple harmonic motion.
Definitions • Simple Harmonic Motion - If an object has vibrations, then it has simple harmonic motion. • Example – swing going back and forth • Frequency – number of cycles in a period of time(sound pitch) • Hertz – unit of measure for vibrations/second • Amplitude – distance from the center line points to the maximum/minimum points (sound volume)
Definitions • Period – length of one cycle • Key Point Intervals – where you are going to plot the points of your sinusoid graphs • Sine: starts at center, then goes to the max amplitude, back to center, and down to min amplitude • Ex – (one cycle) • Cosine: starts at max amplitude, down to center, down to min amplitude, back to center, and back to max amplitude • Ex – (one cycle)
Equation for Simple Harmonic Motion A – amplitude - horizontal stretch/shrink T - time
Other Equations Needed • Period - • Key Point Intervals - • Frequency -
Graphing • To demonstrate how to graph a sinusoid, we are going to use the example equation:
Graphing: Step One • Find Period: ==4 • Find Key Point Intervals: • Find Amp: 8
Graphing: Step 2 • See the video on the website