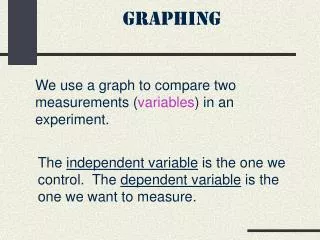
GRAPHING
GRAPHING. Y axis. X axis. IV vs. DV. Independent variable (IV) : Relies on manipulated variable Ex: speed Dependent variable (DV) : Changed by the manipulated variable Ex: time. DRY MIX. D ependent variable. R elies on manipulated. Y axis. M anipulated variable.


GRAPHING
E N D
Presentation Transcript
Y axis X axis
IV vs. DV Independent variable (IV): Relies on manipulated variable Ex: speed Dependent variable (DV): Changed by the manipulated variable Ex: time
DRY MIX Dependentvariable Relieson manipulated Y axis Manipulated variable Independentvariable X axis
Title DV 70 DV vs. IV 60 50 DV (with units) 40 SCALE LABELS 30 20 10 IV 1st 2nd 3rd IV (with units)
TYPES OF GRAPHS • Scatter plot: we use this 90% of the time • Line graph: shows changes over time or space • Bar graph: compares different things • Pie graph: useful with percentages
Speed of A Car TIME (s) DISTANCE (m)
Volume vs. Temp. TEMP ( OC) VOLUME (mL)
KI SOLUBILITY GRAMS DISSOLVED TEMP ( OC)
Abundance of Elements in Lithosphere Elements %
Interpolate vs. Extrapolate • Interpolate: being able to “construct” data points from inside a known data set • Extrapolate: being able to “construct” data points from outside a known data set (predict)
Create the data table! • For the next slides you will create a data table representing the given graph • Be sure to label IV and DV!
Sources of Radiation Exposure sources %
Frozen Dessert Production Frozen dessert Million gallons
USE THE DATA AT THE GREEN DOTS Individual Water Use from 1983-1999 Water Use (Liters per person) Municipal Water Use Per Person from 1983-1999 Year Liters per person