Graphing
Learn the essential parts of a graph in a controlled experiment: the Independent and Dependent variables, Scale, Legend, and Title. Follow step-by-step instructions on constructing a graph to display your data effectively.


Graphing
E N D
Presentation Transcript
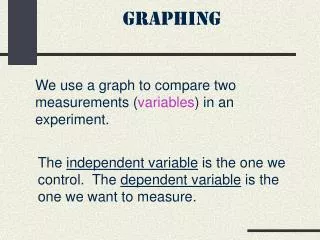
Graphing Graphing used to Display the Data that scientists collected during a controlled experiment.
The FIVE Parts of a Graph • The Independent variable • The Dependent variable • The Scale • The Legend • The Title
Independent or Manipulated Variable • Independent variable belongs on the X or HORIZONTAL axis of the graph. • It represents the data that can be directly controlled or manipulated by the EXPERIMENTER (YOU!). • Examples: time(length of the experiment), distance(depth of the water), temperature, etc. • VARIABLE -part of the experiment that changes
Dependent or Responding Variable • This variable is placed on the Y or VERTICAL axis. • This variable is directly affected by or depends upon the independent variable. • Whatever happens to the independent variable the dependent variable should react to it. • Example: • If we increase the amount of light for plants, the more the plants will grow. • The amount of light is the independent variable while the plant’s growth is dependent upon it.
The Scale • The scale represents the range of values that applies to each variable. • The scale must contain all the data values for each variable. • Each BLOCK must be arranged on the graph using the SAME INTERVALS such as multiples of 2X (2,4, 6,…) or 5X (5, 10, 15,…)AND EVENLY SPACED OUT BETWEEN NUMBERS. • The SAME INTERVALS does not have to be the same for BOTH AXES • NEVER PUT A BREAK IN THE SCALE!
Y X
The Legend • A shortdescription of the graph’s DATA. • This part can usually be found on the right side of the graph. • A legend is important when you are representing more than one set of data.
The Title • The title should be a short statement representing what is found on the graph. • READING the title should give reader an idea about the graph. • It usually contains the independent and dependent variables. • Example: Amount of Sunlight vs. Plant Growth
1. LABEL THE X –AXIS 2. LABEL THE Y-AXIS 3. LABEL THE UNIT OF MEASUREMENT 4. NUMBER EACH AXIS 5. PLOT THE DATA 6. DRAW THE LINE OR BAR 7. TITLE THE GRAPH STEPS IN CONSTRUCTING A GRAPH
Types of Graphs • Line Graph: usually shows change over time • Bar Graph: compares values • Pie Graph: shows parts of a whole • Scatter Plot: shows trends
SCATTER PLOT Cricket Capture