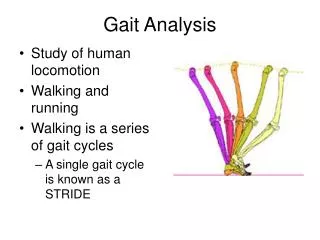
BIOMECHANICS PROJECT: Corrective Gait Analysis
320 likes | 818 Vues
BIOMECHANICS PROJECT: Corrective Gait Analysis. ALAN DION KH 7510 NOVEMBER 29, 2007. INTRODUCTION. STUDY THE GAIT OF A MAN UNABLE TO READILY DORSIFLEX HIS RIGHT FOOT DUE TO DAMAGE TO CERVICAL AREA AND NERVES (HEMIPLEGIA) STUDY ALTERNATE ADAPTIVE/CORRECTIVE GAITS

BIOMECHANICS PROJECT: Corrective Gait Analysis
E N D
Presentation Transcript
BIOMECHANICS PROJECT:Corrective Gait Analysis ALAN DION KH 7510 NOVEMBER 29, 2007
INTRODUCTION • STUDY THE GAIT OF A MAN UNABLE TO READILY DORSIFLEX HIS RIGHT FOOT DUE TO DAMAGE TO CERVICAL AREA AND NERVES (HEMIPLEGIA) • STUDY ALTERNATE ADAPTIVE/CORRECTIVE GAITS • USING DARTFISH AND FORCE PLATE DATA TO MAKE RECOMMENDATIONS ON PREFERRAL CORRECTIVE GAIT
INTRODUCTION • USE OF BIOMECHANICS TO CORRECT PATHOLOGICAL BODY MOVEMENTS • CONSIDERABLE RESEARCH ON CORRECTING PATHOLOGICAL GAITS USING PROTHESES AND ORTHOTICS • LESS RESEARCH ON REVISING GAIT ITSELF
RESEARCH • Chu, T.M & Reddy, N.P. (1995). Stress distribution in the ankle-foot orthosis is used to correct pathological gait. Journal of Rehabilitation Research and Development, 32(4), 349-60. • Abnormal motion of the ankle-foot complex is a common problem in stroke victims, who often develop drop foot, involving excessive and uncontrolled plantar flexion. Using an ankle-foot orthosis (AFO) the researchers modeled the GRFs to study the stress distribution in the AFO during the stance phase of gait. Results showed significant stress concentrations in the AFO in heel and neck regions, with maximum compressive stress during heel contact.
RESEARCH • Burridge, J.H., et al. (2001). Indices to describe different muscle activation patterns, identified during treadmill walking, in people with spastic foot drop. Medical Engineering & Physics, 23(6), 427-34. • The study involved individuals unable to dorsiflex due to lesions of CNS, such as hemiplegia following stroke. The researchers tested subjects with hemiplegia against age-matched unimpaired individuals for treadmill walking. Results showed more dissimilarity in calf activation between the impaired and unimpaired subjects in push-off and early stance than in TA during swing, but the hemiplegic subjects lacked the second peak of activity in initial foot contact.
RESEARCH • Burridge, J.H. & McLellan, D.H. (2000). Relation between abnormal patterns of muscle activation and response to common peroneal nerve stimulation in hemiplegia. Journal of Neurology, Neurosurgery and Psychiatry, 69(3), 353-62. • Researchers used functional electrical stimulation of the peroneal nerve in 18 stroke patients with drop foot and 12 unimpaired subjects. Results showed that patients with the worst control of ankle movement had the best improvement, while those with mechanical resistance to passive movement who had more normal activation responded less well. This supported the hypothesis that stimulation of the peroneal nerve to activate TA also inhibits the antagonist calf muscles.
MEASURES SUBJECT/PARTICIPANT
THE PARTICIPANT(S) STAND-IN “SUBJECT” • Gender: Male • Age: 56 years • Height: 67 in. (170.2 cm) • Weight: 154 lbs. (70 kg) • Inseam: 29 in. (73.7 cm) • Gender: Male • Age: 81 years • Height: 69.5 in. (176.5 cm) • Weight: 152.5 lbs. (69.3 kg) • Inseam: 30 in. (73.7 cm)
MEASURES • DARTFISH: 2-D video analysis system • Determine stride length and velocity • Force platform strain gauge: force plate • Determine Ground Reaction Forces (GRFs) from footfall impacts • Measure z-axis (vertical forces) in Newtons
PROCEDURES • Videotape stand-in participant during normal gait and three corrective/adaptive gaits: • Circumduction • Hip elevation (hip-hitching) • Knee flexion (steppage) Have subject perform all four gaits across force plate in GSU Biomechanics Lab
RESULTS NORMAL AND CORRECTIVE GAITS
NORMAL GAIT GROUND REACTION FORCES LEFT RIGHT
CIRCUMDUCTION GAIT GRFs LEFT RIGHT
HIP-HITCHING GAIT GRFs LEFT RIGHT
KNEE FLEXION (STEPPAGE) GRFs LEFT RIGHT
NORMAL GAIT COMPARISONS • Left Step: 0.69 meters • Right Step: 0.66 meters • Stride: 1.35 meters • Speed (ave.): 1.24 meters/second • Average GRF - Left: 369.9 N; Right: 338.1 N • Maximum GRF – Left: 799.8 N; Right: 755.9 N • Sum of GRFs - Left: 221,558.0 N Right: 219,946.2N
CIRCUMDUCTION GAIT • Left Step: 0.56 meters • Right Step: 0.68 meters • Stride: 1.24 meters • Speed : Left = 1.14 m/s; Right = 0.87 m/s • Average GRF - Left: 312.7 N; Right: 291.4 N • Maximum GRF – Left: 723.0 N; Right: 819.1 N • Sum of GRFs - Left: 314,192.2 N Right: 236,796.4N
HIP ELEVATION GAIT • Left Step: 0.55 meters • Right Step: 0.72 meters • Stride: 1.28 meters • Speed: Left = 0.92 m/s; Right = 0.90 m/s • Average GRF - Left: 302.4 N; Right: 300.3 N • Maximum GRF – Left: 657.1 N; Right: 770.4 N • Sum of GRFs - Left: 276,430.6 N Right: 257,727.2N
KNEE FLEXION GAIT (STEPPAGE) • Left Step: 0.55 meters • Right Step: 0.68 meters • Stride: 1.23 meters • Speed: Left = 1.01 m/s; Right = 0.88 m/s • Average GRF - Left: 311.4 N; Right: 258.2 N • Maximum GRF – Left: 739.3 N; Right: 808.7 N • Sum of GRFs - Left: 286,873.8 N Right: 233,959.7N
PLUSES AND MINUSES FOR ALL • Circumduction has : • Big disparity in velocities, step length, GRFs • Highest overall velocity, so closest to Normal • Hip-hitching has : • Less disparity in velocities and GRFs (ave. & max) • Biggest disparity in step lengths • Knee flexion has : • Big disparities in everything; shortest stride • Lowest Total GRF
CONCLUSIONS (???) • No single factor dominates • No one of the adaptive gaits is clearly superior • None are similar to the normal gait (e.g. left foot GRFs) • Need more research on how to prioritize factors • E.g. Is lower total GRF more important than max GRF as far as impacts to heel and neck of ankle? Toe off? • Is uniformity of stride more important than velocity?
SPECIAL THANKS: Kevin Wasco: Videography & Force plate operation Dr. Mark Geil: Data retrieval


![Strategic Analysis of India’s National River-Linking Project [NRLP]](https://cdn0.slideserve.com/691881/strategic-analysis-of-india-s-national-river-linking-project-nrlp-dt.jpg)