Graphs
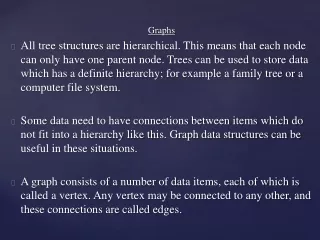
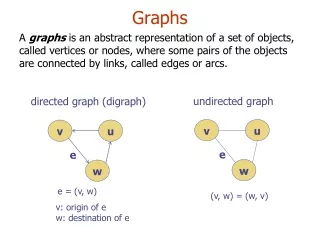
Graphs. Types of Graphs D irect and Inverse R elationships. Line Graphs. Line graphs show a changing relationship between variables (often over time). Direct v. Indirect. Direct. Indirect. The more exercise my cat gets, the less my cat weighs. exercise = weight.


Graphs
E N D
Presentation Transcript
Graphs Types of Graphs Direct and Inverse Relationships
Line Graphs • Line graphs show a changing relationship between variables (often over time)
Direct Indirect The more exercise my cat gets, the less my cat weighs. exercise = weight • The more food my cat eats, the more she weighs. • food = weight
Indirect Direct • The more I practice archery the better I get. • practice = accuracy • The more distractions while I shoot, the lower my score. • distractions = score
Direct Indirect • The more Force I apply, the faster the ball will accelerate • force = acceleration • The more mass a ball has, the slower it will accelerate – if I use the same force • mass = acceleration
Direct Indirect • The faster I go (more speed) the quicker I will get there – using the same distance • speed = time • The less distance I go, the shorter time it takes to get there – at the same speed • distance = time
Bar Graphs • A bar graph is useful for comparing information collected by counting.
Circle Graphs • Also called Pie Graphs • Circular Pie Represents the Total • Shows the different parts of a whole quantity.
The graph above represents the typical day of a teenager. Answer these questions: • 1) What percent of the day is spent watching TV? __________ • 2) What percentage is spent sleeping? _________ • 3) What activity takes up the least amount of time? ________ • 4) What activity takes up a quarter of the day? ________ • 5) What two activities take up 50% of the day? __________ • 6) What two activities take up 25% of the day? __________
Homework • Make a circle graph showing your 5 favorite foods. • Due: • A-day-Tuesday B-day-Wednesday, • August 27th August 28th