Graphing Quadratic Inequalities
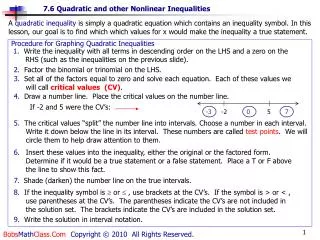
Graphing Quadratic Inequalities. 4.9. ?. 0 > 0 2 + 3( 0 ) – 4. Graph a quadratic inequality. EXAMPLE 1. Graph y > x 2 + 3 x – 4. SOLUTION. STEP 1. Graph y = x 2 + 3 x – 4 . Because the inequality symbol is > , make the parabola dashed. STEP 2.

Graphing Quadratic Inequalities
E N D
Presentation Transcript
? 0> 02 + 3(0)– 4 Graph a quadratic inequality EXAMPLE 1 Graph y > x2 + 3x – 4. SOLUTION STEP 1 Graph y = x2 + 3x – 4. Because the inequality symbol is >, make the parabola dashed. STEP 2 Test a point inside the parabola, such as (0, 0). y> x2 + 3x– 4 0 > – 4
Graph a quadratic inequality EXAMPLE 1 So, (0, 0) is a solution of the inequality. STEP 3 Shade the region inside the parabola.
Use a quadratic inequality in real life EXAMPLE 2 Rappelling A manila rope used for rappelling down a cliff can safely support a weight W(in pounds) provided W ≤ 1480d2 where dis the rope’s diameter (in inches). Graph the inequality. SOLUTION Graph W = 1480d2 for nonnegative values of d. Because the inequality symbol is ≤, make the parabola solid. Test a point inside the parabola, such as (1, 2000).
2000 ≤ 1480 Use a quadratic inequality in real life EXAMPLE 2 W≤ 1480d2 2000≤ 1480(1)2 Because (1, 2000) is not a solution, shade the region below the parabola.
Graph a system of quadratic inequalities EXAMPLE 3 Graph the system of quadratic inequalities. y < – x2 + 4 Inequality 1 y > x2 – 2x – 3 Inequality 2 SOLUTION STEP 1 Graph y ≤ –x2 + 4. The graph is the red region inside and including the parabola y = –x2 + 4.
Graph a system of quadratic inequalities EXAMPLE 3 STEP 2 Graph y > x2– 2x – 3. The graph is the blue region inside (but not including) the parabola y = x2 –2x – 3. STEP 3 Identify the purple regionwhere the two graphs overlap. This region is the graph of the system.
? 0> 02 + 2(0)– 8 for Examples 1, 2, and 3 GUIDED PRACTICE Graph the inequality. y > x2 + 2x – 8 STEP 1 Graph y = x2 + 2x – 8. Because the inequality symbol is >, make the parabola dashed. STEP 2 Test a point inside the parabola, such as (0, 0). y> x2 + 2x– 8 0 > – 4
for Examples 1, 2, and 3 GUIDED PRACTICE So, (0, 0) is a solution of the inequality. STEP 3 Shade the region inside the parabola.
? 0< 02 – 3(0)+ 1 for Examples 1, 2, and 3 GUIDED PRACTICE Graph the inequality. y < 2x2 – 3x + 1 SOLUTION STEP 1 Graph y = 2x2 – 3x + 1. Because the inequality symbol is <, make the parabola dashed. STEP 2 Test a point inside the parabola, such as (0, 0). y< 2x2 – 3x+ 1 0 < 1
for Examples 1, 2, and 3 GUIDED PRACTICE So, (0, 0) is a solution of the inequality. STEP 3 Shade the region inside the parabola.
? 0< 02 + 4(0)+ 2 for Examples 1, 2, and 3 GUIDED PRACTICE Graph the inequality. y < – x2 + 4x + 2 SOLUTION STEP 1 Graph y = – x2 + 4x + 2. Because the inequality symbol is <, make the parabola dashed. STEP 2 Test a point inside the parabola, such as (0, 0). y< – x2 + 4x+ 2 0 < 2
for Examples 1, 2, and 3 GUIDED PRACTICE So, (0, 0) is a solution of the inequality. STEP 3 Shade the region inside the parabola.
for Examples 1, 2, and 3 GUIDED PRACTICE Graph the system of inequalities consisting of y ≥ x2andy < 2x2 + 5. SOLUTION STEP 1 Graph y > x2. – STEP 2 Graph y < 2x2 + 5. STEP 3 Identify the shaded regionwhere the two graphs overlap. This region is the graph of the system.
ANSWER The solution of the inequality is –3 ≤ x ≤ 2. Solve a quadratic inequality using a table EXAMPLE 4 Solve x2 + x ≤ 6 using a table. SOLUTION Rewrite the inequality as x2 + x – 6 ≤ 0. Then make a table of values. Notice that x2 + x –6 ≤ 0 when the values of xare between –3 and 2, inclusive.
– 1+ 12– 4(2)(– 4) x = – 1+33 2(2) x = 4 x 1.19 orx –1.69 Solve a quadratic inequality by graphing EXAMPLE 5 Solve 2x2 + x – 4 ≥ 0 by graphing. SOLUTION The solution consists of the x-values for which the graph of y = 2x2 + x – 4 lies on or above the x-axis. Find the graph’s x-intercepts by letting y = 0 and using the quadratic formula to solve for x. 0 = 2x2 + x – 4
Solve a quadratic inequality by graphing EXAMPLE 5 Sketch a parabola that opens up and has 1.19 and –1.69 as x-intercepts. The graph lies on or above the x-axis to the left of (and including) x = – 1.69 and to the right of (and including) x = 1.19. ANSWER The solution of the inequality is approximately x ≤ – 1.69 or x ≥ 1.19.
ANSWER The solution of the inequality is –1.8 ≤ x ≤ 0.82. for Examples 4 and 5 GUIDED PRACTICE Solve the inequality 2x2 + 2x ≤ 3using a table and using a graph. SOLUTION Rewrite the inequality as 2x2 + 2x –3≤ 0. Then make a table of values.
Robotics EXAMPLE 6 Use a quadratic inequality as a model The number Tof teams that have participated in a robot-building competition for high school students can be modeled by T(x) = 7.51x2 –16.4x + 35.0, 0 ≤ x ≤ 9 Where x is the number of years since 1992. For what years was the number of teams greater than 100?
ANSWER There were more than 100 teams participating in the years 1997–2001. EXAMPLE 6 Use a quadratic inequality as a model SOLUTION You want to find the values of xfor which: T(x) > 100 7.51x2 – 16.4x + 35.0 > 100 7.51x2 – 16.4x – 65 > 0 Graph y = 7.51x2 – 16.4x – 65 on the domain 0 ≤ x ≤ 9. The graph’s x-intercept is about 4.2. The graph lies above the x-axis when 4.2 < x ≤ 9.
EXAMPLE 7 Solve a quadratic inequality algebraically Solve x2 – 2x > 15 algebraically. SOLUTION First, write and solve the equation obtained by replacing > with = . x2 – 2x = 15 Write equation that corresponds to original inequality. x2 – 2x – 15 = 0 Write in standard form. (x + 3)(x – 5) = 0 Factor. x = – 3 orx = 5 Zero product property
(– 4)2–2(– 4) = 24 >15 62 –2(6) = 24 >15 12 –2(1) 5 –1 >15 ANSWER The solution is x < – 3 orx > 5. EXAMPLE 7 Solve a quadratic inequality algebraically The numbers – 3 and 5 are the critical x-values of the inequality x2 – 2x > 15. Plot – 3 and 5 on a number line, using open dots because the values do not satisfy the inequality. The critical x-values partition the number line into three intervals. Test an x-value in each interval to see if it satisfies the inequality. Test x = – 4: Test x = 1: Test x = 6:
for Examples 6 and 7 GUIDED PRACTICE Robotics Use the information in Example 6 to determine in what years at least 200 teams participated in the robot-building competition. SOLUTION You want to find the values of xfor which: T(x) > 200 7.51x2 – 16.4x + 35.0 > 200 7.51x2 – 16.4x – 165 > 0
ANSWER There were more than 200 teams participating in the years 1998 – 2001. for Examples 6 and 7 GUIDED PRACTICE Graph y = 7.51x2 – 16.4x – 165 on the domain 0 ≤ x ≤ 9.
for Examples 6 and 7 GUIDED PRACTICE Solve the inequality 2x2 – 7x = 4 algebraically. SOLUTION First, write and solve the equation obtained by replacing > with 5. 2x2 – 7x = 4 Write equation that corresponds to original inequality. 2x2 – 7x –4= 0 Write in standard form. (2x + 1)(x – 4) = 0 Factor. x = – 0.5 orx = 4 Zero product property
5 – 2 0 1 2 3 4 6 – 6 – 7 – 3 – 1 – 5 7 – 4 2 (– 3)2 – 7 (– 3)> 4 2 (2)2 – 7 (2)> 4 2 (5)2 – 7 (3)> 4 ANSWER The solution is x < – 0.5 orx > 4. for Examples 6 and 7 GUIDED PRACTICE The numbers 4 and –0.5 are the critical x-values of the inequality 2x2 – 7x > 4 . Plot 4 and –0.5 on a number line, using open dots because the values do not satisfy the inequality. The critical x-values partition the number line into three intervals. Test an x-value in each interval to see if it satisfies the inequality. Test x = – 3: Test x = 2: Test x = 5: