Graphing Quadratic Functions
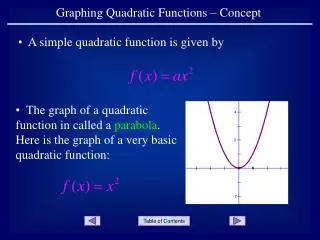
Graphing Quadratic Functions. Lesson 9.3A Algebra 2. Quadratic Function. The standard form of a quadratic function is written:. where a ≠0. and a, b, and c are constants. Sketching a Quadratic Function. The graph of a quadratic function is a U-shaped curve called a parabola .


Graphing Quadratic Functions
E N D
Presentation Transcript
Graphing Quadratic Functions Lesson 9.3A Algebra 2
Quadratic Function The standard form of a quadratic function is written: where a≠0 and a, b, and c are constants.
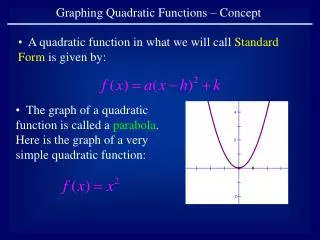
Sketching a Quadratic Function • The graph of a quadratic function is a U-shaped curve called a parabola. • If the leading coefficient a is positive, then the parabola opens up. • If the leading coefficient a is negative, then the parabola opens down.
Minimum and Maximum • If the vertex is the lowest point of the parabola, then it is a minimum. • If the vertex is the highest point of the parabola, then it is a maximum.
Axis of Symmetry The line passing through the vertex that divides the parabola into two symmetric parts. The two parts are mirror images of each other (reflections) about the line of symmetry.
Graph of a Quadratic Function • The graph of y = ax2 + bx + c is a parabola. • If a is positive, then the parabola opens up. • If a is negative, then the parabola opens down. • The vertex has an x-coordinate of • The axis of symmetry is the vertical line
Graphing a Quadratic Function • Find the x-coordinate of the vertex. • Find the y-coordinate of the vertex by plugging the x-coordinate into the quadratic equation and solving for y. • Make a table of values, using the x-values to the left and to the right of the vertex. • Plot the points and connect them with a smooth curve to form a parabola. Example: y = 2x2 + 3x +4
Example Sketch the graph of y = -4x2 – 3x + 2 End of Lesson
Using a Quadratic Model in a Real-Life Problem Lesson 9.3B Algebra 2
Using a Quadratic Modelp. 522, # 65 Path of the dolphin jumping out of the water: h = -0.2d2 + 2d h = height out of the water, d = horizontal distance Our plan: The maximum height reached by the dolphin is the y-coordinate of the vertex. First, we need to find the x-coordinate of the vertex, then plug that value into the original quadratic equation to find the y-value.
Using a Quadratic Modelp. 522, # 65 h = -0.2d2 + 2d so, a = -0.2, b = 2 The dolphin reached a maximum height of 5 feet out of the water.
p. 522, #66 How far did the dolphin jump? Hint: Remember that a parabola is a reflection about the line of symmetry End of Lesson