Download
1 / 4
60 likes | 97 Vues
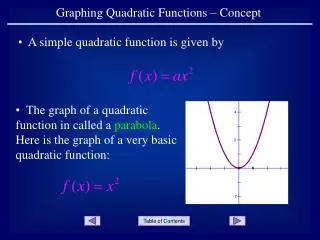
Learn the process of graphing quadratic functions step-by-step, including finding the vertex, plotting points, and determining intercepts for accurate visualization.

E N D
Steps for Graphing • Find the Vertex • the x-value of the vertex is • plug this x-value into y= ax2 + bx + c to find y-value • Use Vertex to make a t-chart • Plot points & sketch graph
Intercepts • x-intercept: The point where the line intersects the X-axis. • (x, 0) • To Find: Let y = 0 & Solve for x • y-intercept: The point where the line intersects the Y-axis. • (0, y) • To Find: Let x = 0 & Solve for y
9.2 Graphing Quadratic Functions Homework: 9.2 Worksheet