Download
1 / 14
140 likes | 264 Vues
This presentation explores quadratic functions in standard form, highlighting key concepts related to their graphs, known as parabolas. It covers how the coefficient 'a' influences the direction (upward or downward) and shape (narrow or wide) of the parabola. The vertex, the highest or lowest point on the graph, is defined, and examples demonstrate how to find it and determine the axis of symmetry. With practical illustrations, the session aims to clarify the graphical representation and mathematical properties of quadratic functions.

E N D
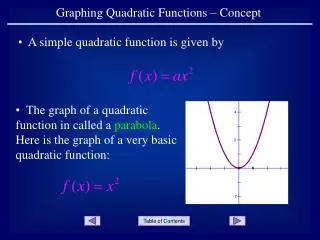
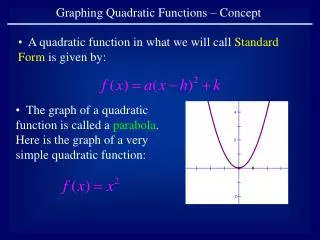
Graphing Quadratic Functions – Concept • A quadratic function in what we will call Standard Form is given by: • The graph of a quadratic function is called a parabola. Here is the graph of a very simple quadratic function:
The value of the coefficient adetermines the direction the parabola faces. • When the value of a is positive, the parabola faces up. • When the value of a is negative, the parabola faces down.
Example 1: Face Down Face Up
The value of the coefficient aalso determines the shape of the parabola. • When |a| > 1 the parabola is narrow. • When 0 < |a| < 1 the parabola is wide.
Example 2: Wide Narrow
Vertex Vertex • The vertex of a parabola is the highest point or the lowest point on the graph of a parabola.
The vertex of a parabola whose function is given in standard form … … is given by V(h,k). • Example 3: The vertex is given by:
Example 3: Put the function in the form of … The vertex is given by:
Here is an easier way to work the last problem: For the h value, take the opposite sign … For the k value, take the same sign … The vertex is given by:
Example 4: The vertex is given by:
The axis of symmetry of a parabola is the vertical line going through the vertex. • Example 5: Draw the axis Notice the symmetry of the two branches of the parabola about the axis.
The equation of the axis of symmetry is given by where h is the x-value of the vertex. In this case, the equation of the axis of symmetry is given by:
SUMMARY Vertex Face Up Face Down Axis of symmetry Narrow Wide