Download
1 / 14
160 likes | 506 Vues
Graphing Quadratic Functions vertex Form. Goal: I can complete the square in a quadratic expression to reveal the maximum or minimum value. (A-SSE.3b). Vocabulary:. The U-shaped graph of a quadratic function. Parabola- Vertex- Axis of symmetry-.

E N D
Graphing Quadratic Functionsvertex Form Goal: I can complete the square in a quadratic expression to reveal the maximum or minimum value. (A-SSE.3b)
Vocabulary: The U-shaped graph of a quadratic function • Parabola- • Vertex- • Axis of symmetry- The highest (maximum) or lowest (minimum) point on a parabola The vertical line that passes through the vertex and divides the parabola into 2 equal parts
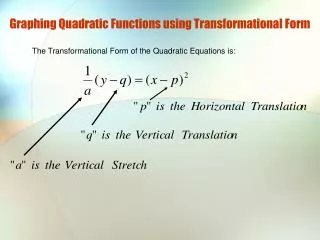
Vertex form of a quadratic function Given the function y = a(x – h)2 + k • If a > 0, the parabola opens up • If a < 0, the parabola opens down • The axis of symmetry is x = h • The vertex is (h, k)
Example • Determine the a to decide if the parabola opens up or down or it’s a minimum or maximum, the coordinates of the vertex and the line of symmetry. • Now let’s Graph!
Now let’s Graph! EXAMPLE Fill in the table of values to graph the quadratic. 3. Plot points: 2. Make a table of values: y = (-5 +3)2+ 2 6 -5 y = (-4 +3)2+ 2 3 -4 2 y = (-2+3)2+ 2 -3 -2 3 y = (-1 +3)2+ 2 -1 6
Example • Determine the a to decide if the parabola opens up or down or it’s a minimum or maximum, the coordinates of the vertex and the line of symmetry. • Now let’s Graph!
Now let’s Graph! EXAMPLE Fill in the table of values to graph the quadratic. 3. Plot points: 2. Make a table of values: y = (-4 +2)2- 6 -2 -4 y = (-3 +2)2- 6 -5 -3 -6 y = (-1 +2)2- 6 -2 -1 -5 y = (0+2)2- 6 0 -2
Example • Determine the a to decide if the parabola opens up or down or it’s a minimum or maximum, the coordinates of the vertex and the line of symmetry. • Now let’s Graph!
Now let’s Graph! EXAMPLE Fill in the table of values to graph the quadratic. 3. Plot points: 2. Make a table of values: y = -4(1-3)2 -16 1 y = -4(2 -3)2 -4 2 0 y = -4(4 -3)2 3 4 -4 y = -4(5 -3)2 5 -16
Change a quadratic function from standard form to vertex form • Move the constant • Add (b/2)2 to each side • Factor the perfect square trinomial • Write in the form y = a(x – h)2 + k • Now let’s Graph!
Now let’s Graph! EXAMPLE Fill in the table of values to graph the quadratic. 3. Plot points: 2. Make a table of values: y = (-4 +2)2+ 2 6 -4 y = (-3 +2)2+ 2 3 -3 2 y = (-1 +2)2+ 2 -2 -1 3 y = (0+2)2+ 2 0 6
Write the quadratic in vertex form • Move the constant • Add (b/2)2 to each side • Factor the perfect square trinomial • Write in the form y = a(x – h)2 + k • Now let’s Graph!
Now let’s Graph! EXAMPLE Fill in the table of values to graph the quadratic. 3. Plot points: 2. Make a table of values: y = (0-2)2- 5 -1 0 y = (1 -2)2- 5 -4 1 -5 y = (3 -2)2- 5 2 3 -4 y = (4 -2)2- 5 4 -1