Download
1 / 19
190 likes | 381 Vues
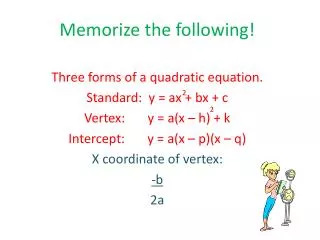
Section 5-2: Graphing Quadratic Functions in Vertex or intercept form. Goal: Graph quadratic functions in different forms. Warm-ups. Find the product: (x + 6)(x + 3) (x – 5) 2 4(x + 5)(x – 5) Write y = x(8x + 12) + 5 in Standard form. Vertex form. y = a(x – h) 2 + k

E N D
Section 5-2: Graphing Quadratic Functions in Vertex or intercept form Goal: Graph quadratic functions in different forms
Warm-ups • Find the product: • (x + 6)(x + 3) • (x – 5)2 • 4(x + 5)(x – 5) • Write y = x(8x + 12) + 5 in Standard form
Vertex form • y = a(x – h)2 + k • When a>0 the parabola opens up • When a<0 the parabola opens down • Step 1:Draw the axis of symmetry. It is the line x = h. • Step 2: Plot the vertex (h, k) • Step 3:Plot two points on one side of the axis of symmetry. Use symmetry to plot two more points on the opposite side of the axis of symmetry • Step 4: Draw a parabola through the points Definition Steps to Graphing
Intercept form • y = a(x – p)(x – q) • When a < 0 the parabola opens down • When a > 0 the parabola opens up • The graph will contain (p , 0) and (q , 0) • Step 1: Draw the axis of symmetry. It is the line x = p + q 2 • Step 2: Find and plot the vertex. The x-coordinate of the vertex is p + q 2 Substitute the x-coordinate for x in the function to find the y-coordinate of the vertex. • Step 3: Plot the points where the x-intercepts, p and q, occur. • Step 4: Draw a parabola Definition Steps for Graphing
Minimum and maximum values • Minimum Value • When a > 0 • Maximum Value • When a < 0
Example 3: find the minimum and maximum value • Tell whether the function y = -4 (x + 6)(x – 4) has a minimum value or a maximum value. Then find the minimum or maximum value.
Example 3: find the minimum and maximum value • Tell whether the function y = ½ (x + 8)2 – 12 has a minimum value or a maximum value. Then find the minimum or maximum value.
Example 3: find the minimum and maximum value • Tell whether the function y = 3(x – 4)(x – 7) has a minimum value or a maximum value. Then find the minimum or maximum value.