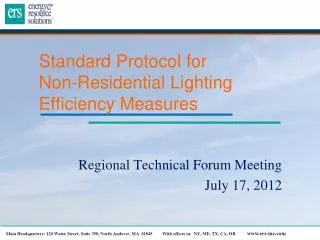
RTF Lighting Standard Protocol
Analyzing hours of operations data from various sources to assess effectiveness of default protocols and control savings. Conclusions and recommendations for building types provided.

RTF Lighting Standard Protocol
E N D
Presentation Transcript
RTF Lighting Standard Protocol Review of Hours of Operations, Controls Savings, and Variation
Hours • Context: SR relies on interview used for hours with default as backup. How do our proposed defaults look? • Review measured hours versus default • Caveats • All logged data by some method from studies meant to ascertain hours • Unknown protocols for annualization • Unknown site sampling procedures & duration • Know little about building/occupant charateristics • Litlle know about sample selection • It would take substantial time mine for those unknowns
Hours of Operations Datasets Used • CPUC & Itron. (2010). Small Commercial Contract Group Direct Impact Evaluation Report CALMAC Study ID: CPU0019.01. Retrieved from http://www.calmac.org/abstract.asp?id=2739 • CPUC Database for Energy Efficient Resources (DEER). (2010). Summary of 2008 DEER Measure Energy Analysis Revisions Version 2008.2.05 – 09-11 Planning/Reporting Version, Comparison of 2005 and 2008 EFLH for Lighting. Retrieved from http://www.deeresources.com/deer0911planning/downloads/DEER2008UPDATE-EnergyAnalysisMethodsChangeSummaryV9.pdf • New York State. (2012). New York State Technical Resource Manual. Retrieved from http://www.aging.ny.gov/livableny/ResourceManual/Index.cfm • Bonneville Power Administration. (2011). BPA C&I Lighting Calculator. Retrieved from http://www.bpa.gov/energy/n/projects/lighting
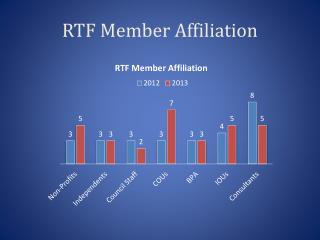
Default from Calculator Total = 27 default options Reviewed = 14 Reviews were completed on datasets that had over 4 quality data points. Descriptive statistics were completed on all analyzed default inputs. Data was cleaned by eliminating statistical outliers. See workbook for full statistical analysis. (tab: Stats Review of Hours)
Some Conclusions • Significant range for hours within some building use types highlights the importance of the interview part of SRM • Use of default carries more uncertainty in some use types than others • Default hours for some building use types should be revised • Test of simplest reliable needs to include how often default is used • What is correlation between logged hours and reported business hours?
Hours of Operations Conclusion • Hours of Operations varies across building types and within building types. It depends on the building, occupants, type of work, and location within the building (e.g.: office vs. break room vs. computer room vs…..) • Because of large variation within building types it will be difficult to use defaults and estimate accurate operating hours • Even within the same utility, different programs report different operating hours for the same building type. • A regional primary study would most likely return the same uncertainty and not be worth the $$.
Control savings as a % Issues: • Most analysis, case studies focus on full lighting retrofits not just control upgrades • There are large variations in control only reported data • Type of lights, control settings, and operating hours all effect results • Location of controls effects performance 3 studies are presented to show the variability
LBNL Meta-Analysis from Lighting Controls • Focus on commercial buildings by building type • 240 savings estimates from 88 papers and case studies • Control types evaluated = Occupancy, Day lighting, Personal tuning, Institutional Tuning, and multiple types • Report website: http://efficiency.lbl.gov/drupal.files/ees/Lighting%20Controls%20in%20Commercial%20Buildings_LBNL-5095-E.pdf
LBNL Meta-Analysis Conclusions • Table 7 page 15 • These are the data points used in the calculator • These points are the average of all studies analyzed • These numbers include studies that are calculations and actual installation
LBNL Meta-Analysis Conclusions • Large Standard deviations indicated (+ - 20%) uncertainty and varying results • Actual installations are not broken up by building type
Rensselaer Polytechnic Institute review of Occupancy Sensors • Evaluation of Documented and undocumented studies by building location type • Evaluation identifies ranges and average savings • Most data evaluated reported prior to 2001
Rensselaer Polytechnic Institute review of Occupancy Sensors Findings
M & V of Day lighting Photocontrols • 5 Buildings evaluated (office, school, manufacturing, medical, warehouse) • Looked at the direction of Office Spaces • All locations based in Idaho • Report website: http://www.idlboise.com/pdf/papers/20100111_Final_Photo%20Controls.pdf
M & V of Day lighting Photocontrols Findings • Results from monitoring period during regular operation hours • Direction of Offices has large significant impact on savings • Variations in site savings provides uncertainty • Numbers and savings % are different from the LBNL study
Controls Savings Conclusions • Documented variations are large • Occupancy variations, directional variations, and space type variations, add to uncertainty • Small samples of installations do not accurately represent the population of installations • Most calculations overestimate actual savings