Initial Performance of the BaBar Experiment
190 likes | 379 Vues
Initial Performance of the BaBar Experiment. Owen Long University of California, Santa Barbara. Lake Louise Winter Institute February 20-26, 2000. Measuring CP violation in the B system. Experimental Requirements:.

Initial Performance of the BaBar Experiment
E N D
Presentation Transcript
Initial Performance of the BaBar Experiment Owen Long University of California, Santa Barbara Lake Louise Winter Institute February 20-26, 2000
Measuring CP violation in the B system Experimental Requirements: Interference between mixing and direct decay of B0 to a CP eigenstate leads to the time-dependent asymmetry • Produce and observe millions of B hadrons / year. • Measure (“tag”) initial flavor of B hadron that decays to • For resonance: produced coherently. Where: ranges from to is the number of that decay to at time Measurementof essential! is the number of • For or that decay to at time and hadronize independently. Typical branching fraction for ranges from 0 to is or less. if
Flavor Tagging dt ? B ? fcp 0 U(4s) ? B 0 Time Can’t hope to fully reconstruct. Use flavor of daughters to tag B flavor. - Kaons Leptons l B lnx 10% - n B b c s K 0 B b 0 c + B b c s K 0 Need to worry about - c - + l 0 K x D 53 % l u + K x 3 % n n c - c B s b 0 0 c K x D 24 % d + K x 6 %
PEP-II asymmetric B factory design parameters 33 • Luminosity = 3 x 10 cm s. • Achieved through high currents and strong focusing. • HER(e ) = 990 mA, LER(e ) = 2160 mA, 1658 bunches. • L x 1.05 nb x 10 s / year = 30 million BB / year. • Satisfies high statistics requirement for CP measurement. • Beam energies: HER(e ) = 9.0 GeV, LER(e ) = 3.1 GeV. • B hadrons in lab havebg = 0.56 , ctbg = 250 mm. • Boost of CM frame means can measure delta z which gives delta t. -1 -1 - + 7 U(4s) - + delta z e e
PEP-II performance -1 2.7 fb Timeline: -1 • May 97 - HER commissioning begins • July 98 - LER installation complete. • HER: 759 mA, 1222 bunches. • Feb 99 - LER: 1171 mA (world record). • March 99 - Install BaBar. • L = 5.2 x 10 , 786 bunches. • HER: 350 mA, LER: 680 mA. • May 99 - First collisions with BaBar. • Nov 99 - L = 1.4 x 10(world record). DIRC installation Integrated Lumi (fb ) Vacuum leak 32 June 99 Feb 00 33 -1 • Luminosity already 1/2 design. • Always on or ahead of schedule. • Backgrounds a bit high but • within operational limits. -1 60 pb Lumi per day (pb ) June 99 Feb 00
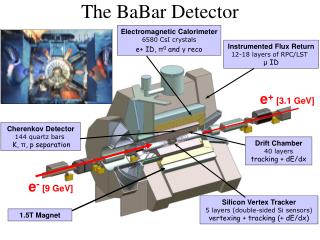
The BaBar Experiment • Silicon Vertex Tracker (SVT): 5 layers of double-sided Si. Delta z resolution < 120 mm. • Drift chamber (DCH): P measurement and particle ID through dE/dX (low P). • Detector of Internally Reflected Cherenkov Light (DIRC): particle ID (high P). • Electromagnetic calorimeter (EMC): p and K-long reconstruction, e ID. • Instrumented Flux Return (IFR): m ID and K-long reconstruction. • Trigger: Two levels: L1 up to 2 KHz, L3 up to 100 Hz. • Offline software and event store: C++ and Object Oriented databases. 0 0 0 1.5 T Superconducting Solenoid Electromagnetic Calorimeter Drift Chamber DIRC Instrumented Flux Return Silicon Vertex Tracker
The Silicon Vertex Tracker • Design features: • 5 layers, double-sided Si. • Custom rad-hard readout IC. • Low mass design. • Inner 3-layers: angle and d0 • Outer 2-layers: pattern rec. • Low Pt tracking (50-200 MeV). • Operating history: • 9 / 208 sections bad (4.3%). • 8 bad at time of installation. • 1developed short after • solenoid quench. • Noise levels consistent with • test bench measurements: • Noise 800 - 1600 ele • MIP signal 22000 ele • No unexpected radiation • damage. • 5 p-stop shorts out of • 152,000 channels!
Silicon Vertex Tracker Performance • Single hit resolution in Layer 1: • Most important layer for delta z. • Data performance is consistent • with Monte Carlo and design spec. • SVT-DCH relative alignment: • SVT moves by as much as 100 mm • in a diurnal pattern. • SVT-DCH alignment is produced • for every run! • Alignment is done automatically • as a “rolling” calibration in prompt • reconstruction. • Good SVT-DCH alignment is crucial • for obtaining good mass resolution. 60 40 20 0 Layer 1 hit resolution (mm) 60 Delta x 100 mm 40 20 0 1 day
The Drift Chamber Rout = 81 cm • Design specifications: • 10 super-layers, 4 cells / super-layer. • Operates in 1.5 T solenoid. • Average spatial resolution per cell < 140 mm. • dE/dX resolution 7% with 40 measurements. • Low-mass design: • Gas: 80% Helium • Inner cylinder: 1mm Beryllium (0.28 % X ). • Outer cylinder: Carbon fiber, foam (1.5% X ). 0 0 Cell geometry with 50 ns isochrones. 1.2 cm Rin = 23.6 cm 1.8 cm
Drift Chamber Performance • Momentum resolution: • Measured with di-muon events. dPt / Pt = 2.9 % x Pt. Consistent with spec. • Hit resolution: • Measured to be 100 - 200 mm, average value 125 mm. Exceeds spec of 140 mm. • dE/dX resolution: • Measured 7.5% with bhabha events. • Hope to achieve 7% with further corrections. DCH Hit Resolution 200 mm 100 mm
Integrated tracking performance • Mass resolution: • D K p sm = 7.9 +/- 0.2 MeV/c • D D p, D K ps(m(Kpp) - m(Kp)) = 252 +/- 12 KeV (55%) • Impact parameter resolution: • Measured with hadronic and di-muon events. • The errors on dxy and dz are comparable. • Asymptotic resolution < 40 mm. - 0 + - + * 0 0 + + Impact parameter resolution
The Detector of Internally Reflected Cherenkov Radiation (DIRC) • How it works: • Cherenkov light generated in quartz with: cos q = 1/(nb) . • Angle q preserved as light internally reflects in quartz. • Cherenkov ring of photons expands in water tank and is detected • with array of photomultipliers. • Technical challenges: • Typical photon: 6 - 10 m path length, 300 reflections. • Quartz bars need to be very polished, parallel, • and rectangular with sharp edges. • Surface polish: RMS 5 - 10 angstroms! • Nearly too challenging for vendor. • Bars delivered 18 months late. • Serious cost overrun. Photomultiplier tube Water (n=1.34) Quartz bar (n=1.473) mirror 5 m 1.17 m
DIRC performance and comparison with dE/dx • Cherenkov angle resolution measured to be 3.0 mrad. • Angle difference for Kp at 4.0 GeV/c is 6.4 mrad. • Improvements that will lead to design goal of 2 mrad: • Better event t measurement gives better BG rejection. • Improved reconstruction algorithm. • DIRC and DCH dE/dx both give > 2s Kp separation • at high momenta with current reconstruction. • Particle identification will only get better!
The Electromagnetic Calorimeter • Design characteristics: • 6580 crystals of CsI(Tl) • Reconstruct g down to 10-20 MeV. • Target resolution: • Performance: • E/P width from bhabhas 2.4 % • consistent with MC expectations. • Correct p mass. A bit wider than • the MC. • Significant improvements in noise. • Energy cut per crystal now 0.8 MeV. 0
The Instrumented Flux Return • Graded segmentation of iron layers optimized for m ID and K-long • reconstruction. • Early operation had problems with iron heating up leading to high • currents in the RPCs. • Fixed by adding water cooling.
Some preliminary analysis plots - - + • J/Y e e and J/Ymm. • Plots are from • J/Y e e 540 pb. • J/Ym m 380 pb. • Yield is in rough agreement with • expectations. • Mass resolution a bit wide. • Data 15 MeV/c. • MC 11 MeV/c. • Muon selection is very loose due to • hardware problems in the IFR. • Working on recovering the • Bremsstrahlung tail in J/Y e e. + - -1 + - -1 + 2 2 - +
Some preliminary analysis plots -1 • Analysis uses 620 pb. • Exclusive J/Y modes: • B J/Y K • B J/Y K , K K p , K p p . • B J/Y K , K K p . • B J/Y K , K p p . • Yield consistent with expectations. • Improvements in calibration and • reconstruction will increase efficiency, • improve mass resolution, and signal • to noise. Combined J/Y modes + + + + - + 0 * 0 * + + s s - * * 0 0 + 0 - 0 0 + 0 s s 0 0 B J/Y K s
What to expect from BaBar and PEP-II in the future • Goals for BaBar and PEP-II: • Record 10 fb on peak luminosity by the end of the summer. • Already have 2 fb in the can. • First BaBar measurement of sin(2b). • Requirements for meeting goals: • Steady increase of PEP-II luminosity from 1.5x10 to 3.0x10 . • Combined BaBar & PEP-II overall efficiency >= 50%. -1 -1 33 33 Stay Tuned!