Practical Uses of NC-CATCH
160 likes | 379 Vues
Practical Uses of NC-CATCH. DA. DA. D. D. D. DA. D. DATA. D. DATA. DATA. DA. DA. DATA. What is NC-CATCH?. N orth C arolina C omprehensive A ssessment for T racking C ommunity H ealth. Data Warehouse Collection of Datasets Tool Compiles county, regional, state data

Practical Uses of NC-CATCH
E N D
Presentation Transcript
DA DA D D D DA D DATA D DATA DATA DA DA DATA What is NC-CATCH? NorthCarolinaComprehensiveAssessmentforTracking CommunityHealth • Data Warehouse • Collection of Datasets • Tool • Compiles county, regional, state data • Analyzes county, regional, state data • Requirements • High Speed Internet • Internet Explorer • Adobe Acrobat Player
About NC-CATCH Provides data that are: • Quantitative • Information that can be measured or counted • Number of cases of disease • Percents • Rates • Secondary • Information collected by someone else
Usefulness • Community Health Assessment • State-of-the-County’s Health Report • Grant development • Planning and monitoring within health departments and community groups • Reports to the County Commissioners, City Council, and others in policy development • Community presentations • Articles and news releases • Responses to public inquiries
Benefits & Limitations • Benefits • Data available from many sources • Data easy to organize, manipulate, and present • Tailored information quick and easy • Convenient visual aids (graphs and charts) • Limitations • May need data from other sources • Not all health indicators available in design phase • Dynamic program – expect changes/upgrades
Types of Data • Demographics • Per Capita Income • Unemployment • Free/Reduced Lunch • Medicaid • Uninsured • High School Dropout Rate • Mental Health • Morbidity and Mortality • Hospital Discharge • Emergency Room Visits • Behavioral Risk Factors • Health Professionals • Maternal, Infant and Child Health • Dental Services Data Sources: NC State Center for Health Statistics – BRFSS - Claritas – Cecil B. Sheps Center for Health Services Research, UNC – National Center for Health Statistics
What’s the difference? SCHS website has most data found on NC-CATCH plus… • High risk births • Childhood obesity • Child Health Assessment and Monitoring Program (CHAMP) • Pregnancy Risk Assessment Monitoring System (PRAMS) • Health Atlas NC-CATCH has most data found on SCHS plus… • Years Potential Life Lost (YPLL) • Medicaid/WIC • Socioeconomic data • Emergency and hospital data • Mental health • Patient/healthcare professional ratio
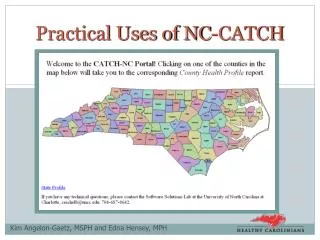
NC-CATCH Tools • County Health Profile Report (Public Access) • Quick and Easy • Organized by health categories • Design Phase (Login and Password Required) • Datasets are organized by topic • Allows deeper analysis
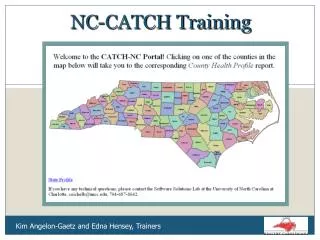
County Health Profile Portal (Public Access) Click here
County Health Profile • Click on the (blue) name of a health indicator to get an interactive Indicator Fact Sheet • Click on “Print” to geta PDF of all information on one health topic • Click on + to find specific fact sheets
County Indicator Fact Sheets • County Name • Indicator Category and Title • Numerator and Denominator source • Description of Health Indicator • Peer County List (3 0r 4 Counties) • % population < 18 years • % population > 64 years • % non-white population • % families with children below the poverty level • Total population • Charts and Graphs
Data Available in Design Phase • Cancer Registry Demographics (Case Counts & Rates, Geographic & Demographic data) • Composite Matched Birth Demographics (Births Correlated to Deaths) • Death By Ethnicity (Hispanic Ethnicity) • Death By Race • Emergency Visit Demographics • Hospital Discharges and Death • Hospital Deaths and Emergency Department Visits • Hospital Discharge Demographics (Principal diagnosis, Payer information, Demographic and Geographic data) • Pregnancy Demographics
Design Phase:Charts and Graphs Bar Chart Pie Chart Line Graph
Questions? Training: Gerell Smith-- Office of Healthy Carolinians/ Health Education Email:gerell.smith@dhhs.nc.gov Phone: (919) 707-5153 Technical Assistance: Chris Eichelberger-- Software Solutions Lab at UNC Charlotte Email: ceichelb@uncc.edu Phone: (704) 687-8642 Data Questions or Comments: Kathleen Jones-Vessey-- State Center for Health Statistics Email: kathleen.jones-vessey@dhhs.nc.gov Phone: (919) 715-9692