Staples Module 4 Presentation
Staples Module 4 Presentation. Mary Astuno 3 February 2013. Introduction to Staples. Staples, Inc. and its subsidiaries is the world's leading office products company. Reach customers through contract, on-line, catalog and retail sales channels that are designed to be convenient.

Staples Module 4 Presentation
E N D
Presentation Transcript
Staples Module 4 Presentation Mary Astuno 3 February 2013
Introduction to Staples • Staples, Inc. and its subsidiaries is the world's leading office products company. • Reach customers through contract, on-line, catalog and retail sales channels that are designed to be convenient
Business Segments North American Commercial segment consists of the U.S. and Canadian business units that sell and deliver office products and services directly to businesses, including Staples Advantage and Quill.com. International Operations segment consists of businesses in 23 countries in Europe, Australia, South America and Asia] Reported negative NI of $210.7M for FY 2012
Lower EPAT from Estimated 2013 data • Staples is February 2 YE • Issue arises with Sales forecast: • Yahoo Finance forecasted sales of 23.2B • Chose to use Q3 cumulative data from 39 weeks to maintain continuity with other figures to arrive at EPAT consistent with current figures • Consequently, EPAT for 2013 isn’t completely accurate. It is lower than prior years.
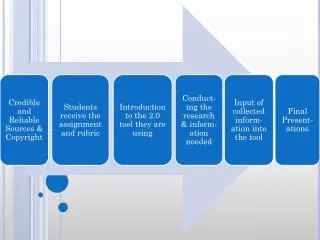
Info taken from third quarter 10Q In the third quarter of 2012, the Company announced a strategic plan (the “Plan”) aimed at accelerating growth, particularly in the Company's online businesses. Elements of the Plan include more fully integrating our retail and online offerings, restructuring our International Operations segment and improving the productivity of our stores in North America. Pursuant to the Plan, the Company plans to: ▪ close 46 retail stores in Europe and accelerate the closure of 15 retail stores in the United States; ▪ close and consolidate certain sub-scale delivery businesses in Europe; ▪ pursue the sale of PSD; ▪ reorganize certain general and administrative functions in Europe; and ▪ rebrand its business in Australia from the Corporate Express tradename to the Staples tradename.
10Q Continued… “As a result of the actions to be taken under the Plan, including those taken in the third quarter of 2012, the Company estimates that it will incur total pre-tax restructuring charges related to continuing operations of $100.0 million to $120.0 million for ongoing lease obligations related to facility closures, $70.0 million to $90.0 million for employee severance and benefit costs, and $10.0 million to $20.0 million for other closure related expenses” “ Of these amounts, approximately $145.0 million to $195.0 million relates to the Company's International Operations segment and approximately $35.0 million relates to the North American Retail segment. The Company expects to substantially complete the actions required under the Plan by the end of fiscal 2013”
Enterprise Profit Margin (EPM) Reveals how much operating profit the firm earns from each sales dollar
Enterprise Asset Turnover Measures the productivity of the firm’s enterprise assets Reveals the level of sales the firm realizes from each dollar invested in enterprise assets. Median for publicly traded companies over the past decade is $1.40, making Staples higher than industry average.
Analysis Most of the analysis is skewed due to inaccurate 2013 YE information (10K has not been released). Forecasts using only 2012 data: Results show greater and more consistent values for Sales, EPAT and NEA figures
The End Questions, comments?