Download
1 / 30
300 likes | 448 Vues
Physical Oceanography: What it is and why we should care. Robert H. Weisberg Distinguished University Professor College of Marine Science Physical Oceanography 5/29/08. Outline:. What is Marine Science? What is Physical Oceanography? Some recent success stories

E N D
Physical Oceanography: What it is and why we should care Robert H. Weisberg Distinguished University Professor College of Marine Science Physical Oceanography 5/29/08
Outline: • What is Marine Science? • What is Physical Oceanography? • Some recent success stories • Coastal ocean observing and modeling • Red tide • Hurricanes and Storm Surge • Fresh water management • Turbulence modeling implications • Sea level rise • Tampa Bay PORTS
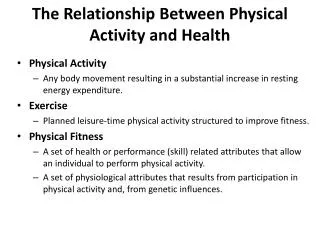
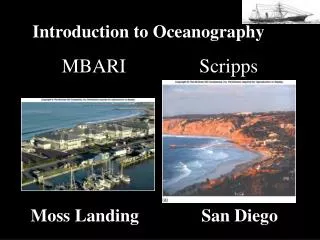
What is Marine Science? What it is not:It is not Marine Biology! It is:The application of Physics, Chemistry, Geology, and Biology to the study of the Oceans and the Ocean-Atmosphere and the Ocean-solid Earthinteractions. Goals:To observe, understand, and predict the state of the ocean and the Earth’s climate and ecology.
What is Physical Oceanography? The application of physics to the Ocean circulation and to the Ocean-Atmosphere interactions that give rise to climate. The Earth’s climate and hence our existential being has its basis in Physical Oceanography. Why? The Earth receives more energy then it radiates in the tropics, whereas it radiates more energy than it receives at the poles. Ocean currents and winds result from this imbalance. Winds drive currents; currents determine temperature, which (via pressure) drives winds. Thus the Ocean-Atmosphere system is intimately coupled, and this determines Climate. Currents unite nutrients with light, and this is the underpining for the Earth’s Ecology.
West Florida Continental Shelf: The continental shelf is the transition region between the deep-ocean and the coastline. Continental shelves are amongst the most biologically productive and societally important regions of the oceans. A coordinated program of observations and models with applications to red tide, fisheries, …..
The Problem What determines the water properties on the broad WFS, influenced by: 1) the Gulf of Mexico Loop Current, 2) local winds and heat flux, and 3) land drainage. For instance, why do red-tides repetitively bloom, concentrate, and die off? The circulation physics are essential since the circulation unites nutrients with light, distributes water properties, and aggregates species.
WFS:In-situ Observations http://comps.marine.usf.edu http://ocgweb.marine.usf.edu
West Florida Continental Shelf: WFS ROMS nested into the Global HYCOM A regional model (ROMS) is nested in a global model (HYCOM). The regional model is forced by the deep-ocean (through the open boundary) and by local winds, heat fluxes and rivers.
WFS: Across shelf transport in bottom Ekman layer. Cold, nutrient-rich water upwells onto the shelf by the combined effects of local and LC forcing. 18º (A) Bottom Ekman layer currents transport these waters to the coast. (B)
AnUpwelling Event. May 1998 upwelled water at Sanibel came from the Florida Big Bend shelf break some 300 km away.
WFS: Nowcast/Forecast Model Salinity Redtide tracking Temp. http://ocgweb.marine.usf.edu
Red Tide Center for Prediction of Red tide (CPR), joint with FWC John Walsh Bob Weisberg Cindy Heil A multidisciplinary collaboration established with new, 5-year grants from NOAA and FWC. An initial accomplishment: Explanation of why 2006 was a significant WFS red tide year, whereas 2007 was not – retention, versus export. An inverse correlation exists for fish since red tide kills them.
Model simulated surface drifter trajectories: 8/6/07 and 9/6/2007 9/21/06 and 10/6/2006 Red tide went to the east coast in 2007; it stayed on the west coast in 2006
Evolution of the 2005 Red Tide: Advection toward Charlotte Harbor Jan.13th Feb.18th Drifter colors represent depth
T/S modeled at the C10 location showing the stratification: Low salinity water came from TB; not CH
Estuaries • Estuaries are the transition regions between the rivers and the ocean. This is where “society meets the ocean.” • Applications to hurricane storm surge, fresh water management, ….
The pathways of the estuarine circulation across the mouth of the bay: Red tide (in 2005) entered through Egmont channel. The Complexity of the estuarine circulation across the mid-section of the bay
Estuaries: Rookery and Naples Bays. Applications to Fresh Water Management.
Hurricanes and Storm Surge: What may have occurred had Hurricane Ivan made landfall here instead of on the Florida/ Alabama border?
Ivan Winds on approach and at Landfall While Ivan reached category 5 in the Caribbean it was a 4 upon approach and a 3 at landfall. Categorymphknotsm/s 1 74-95 64-82 33-43 2 96-110 83-95 44-49 3 111-130 96-113 50-59 4 131-155 113-135 60-70 5 >155 >135 >70
Maximum IRB landfallsurge relative to land at sub-domains emphasizing St. Pete Be. (left), Old Tampa Bay (middle), and Hillsborough Bay (right).
3-D and 2-D Model Comparison Absolute (black) and percent (red) differences between 3-D and 2-D surge simulations at four positions from the mouth to the head of the bay.At peak surge, the2-D model is in error by up to 35% relative to the 3-D model with all else the same. This suggests that we reconsider how storm surges are modeled. NOAA, FEMA, and USACE presently use 2-D models.
Ocean-Atmosphere Turbulence Modeling • Turbulence in the ocean and atmosphere plays a major role in the balances that determine the currents, winds and their properties. Numerical models cannot resolve these so parameterizations are necessary. • Applications to regional weather models, climate models, and to more esoteric studies, …. Boris Galperin
The ocean-Jupiter connection Boris Galperin
The Global-Ocean • The global ocean, via its interactions with the atmosphere, is responsible for climate. • Applications to sea level rise, ….
What we should’ve seen? Gary Mitchum
Tampa Bay PORTSPhysical Oceanographic Real-Time System Operated in collaboration with NOAA/NOS/COOPS and local maritime interests; funded by State and County trust funds and local users. Voice: 1-866-TB-PORTS Internet:tidesandcurrents.noaa.gov or ompl.marine.usf.edu/PORTS Successes: Ship groundings decreased by 60%.Benefits exceed operating costs by 25 to 50 times. Mark Luther