Detailed Analysis of PCA: Linear Algebra, SVD, and Multivariate Probability Distributions
This analysis delves into Principal Component Analysis (PCA), exploring its mathematical framework, linear algebra foundations, and optimization aspects. We review crucial topics like Singular Value Decomposition (SVD) and Eigenvalue Decomposition, discussing their relationships and computational intricacies. The review highlights empirical statistical methods, including covariance matrix calculations, focusing on dimensions of data variability. The aim is to grasp PCA's role in revealing underlying structures in high-dimensional datasets through optimization techniques and statistical interpretations.

Detailed Analysis of PCA: Linear Algebra, SVD, and Multivariate Probability Distributions
E N D
Presentation Transcript
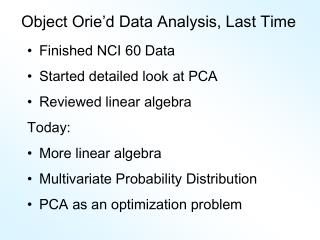
Object Orie’d Data Analysis, Last Time • Finished NCI 60 Data • Started detailed look at PCA • Reviewed linear algebra Today: • More linear algebra • Multivariate Probability Distribution • PCA as an optimization problem
Detailed Look at PCA • Three important (and interesting) viewpoints: • Mathematics • Numerics • Statistics • 1st: Review linear alg. and multivar. prob.
Review of Linear Algebra (Cont.) Singular Value Decomposition (SVD): For a matrix Find a diagonal matrix , with entries called singular values And unitary (rotation) matrices , (recall ) so that
Review of Linear Algebra (Cont.) • Intuition behind Singular Value Decomposition: • For a “linear transf’n” (via matrix multi’n) • First rotate • Second rescale coordinate axes (by ) • Third rotate again • i.e. have diagonalized the transformation
Review of Linear Algebra (Cont.) SVD Compact Representation: Useful Labeling: Singular Values in Increasing Order Note: singular values = 0 can be omitted Let = # of positive singular values Then: Where are truncations of
Review of Linear Algebra (Cont.) SVD Full Representation: =
Review of Linear Algebra (Cont.) SVD Reduced Representation: = Assumes
Review of Linear Algebra (Cont.) SVD Reduced Representation: = Assumes
Review of Linear Algebra (Cont.) SVD Compact Representation: =
Review of Linear Algebra (Cont.) SVD Compact Representation: =
Review of Linear Algebra (Cont.) Eigenvalue Decomposition: For a (symmetric) square matrix Find a diagonal matrix And an orthonormal matrix (i.e. ) So that: , i.e.
Review of Linear Algebra (Cont.) • Eigenvalue Decomposition (cont.): • Relation to Singular Value Decomposition • (looks similar?): • Eigenvalue decomposition “harder” • Since needs • Price is eigenvalue decomp’n is generally complex • Except for square and symmetric • Then eigenvalue decomp. is real valued • Thus is the sing’r value decomp. with:
Review of Linear Algebra (Cont.) • Better View of Relationship: • Singular Value Dec. Eigenvalue Dec. • Start with data matrix: • With SVD: • Create square, symmetric matrix: • Note that: • Gives Eigenanalysis,
Review of Linear Algebra (Cont.) • Computation of Singular Value and Eigenvalue Decompositions: • Details too complex to spend time here • A “primitive” of good software packages • Eigenvalues are unique • Columns of are called • “eigenvectors” • Eigenvectors are “ -stretched” by :
Review of Linear Algebra (Cont.) • Eigenvalue Decomp. solves matrix problems: • Inversion: • Square Root: • is positive (nonn’ve, i.e. semi) definite all
Recall Linear Algebra (Cont.) Moore-Penrose Generalized Inverse: For
Recall Linear Algebra (Cont.) • Easy to see this satisfies the definition of • Generalized (Pseudo) Inverse • symmetric • symmetric
Recall Linear Algebra (Cont.) Moore-Penrose Generalized Inverse: Idea: matrix inverse on non-null space of the corresponding linear transformation Reduces to ordinary inverse, in full rank case, i.e. for r = d, so could just always use this Tricky aspect: “>0 vs. = 0” & floating point arithmetic
Recall Linear Algebra (Cont.) Moore-Penrose Generalized Inverse: Folklore: most multivariate formulas involving matrix inversion “still work” when Generalized Inverse is used instead
Review of Multivariate Probability Given a “random vector”, A “center” of the distribution is the mean vector,
Review of Multivariate Probability Given a “random vector”, A “measure of spread” is the covariance matrix:
Review of Multivar. Prob. (Cont.) • Covariance matrix: • Noneg’ve Definite (since all varia’s are 0) • Provides “elliptical summary of distribution” • Calculated via “outer product”:
Review of Multivar. Prob. (Cont.) Empirical versions: Given a random sample , Estimate the theoretical mean , with the sample mean:
Review of Multivar. Prob. (Cont.) Empirical versions (cont.) And estimate the “theoretical cov.” , with the “sample cov.”: Normalizations: gives unbiasedness gives MLE in Gaussian case
Review of Multivar. Prob. (Cont.) Outer product representation: , where:
PCA as an Optimization Problem Find “direction of greatest variability”:
PCA as Optimization (Cont.) Find “direction of greatest variability”: Given a “direction vector”, (i.e. ) Projection of in the direction : Variability in the direction :
PCA as Optimization (Cont.) Variability in the direction : i.e. (proportional to) a quadratic form in the covariance matrix Simple solution comes from the eigenvalue representation of : where is orthonormal, &
PCA as Optimization (Cont.) Variability in the direction : But = “ transform of ” = “ rotated into coordinates”, and the diagonalized quadratic form becomes
PCA as Optimization (Cont.) Now since is an orthonormal basis matrix, and So the rotation gives a distribution of the (unit) energy of over the eigen-directions And is max’d (over ), by putting all energy in the “largest direction”, i.e. , where “eigenvalues are ordered”,
PCA as Optimization (Cont.) • Notes: • Solution is unique when • Else have sol’ns in subsp. gen’d by 1st s • Projecting onto subspace to , • gives as next direction • Continue through ,…, • Replace by to get theoretical PCA • Estimated by the empirical version
Connect Math to Graphics 2-d Toy Example Feature Space Object Space Data Points (Curves) are columns of data matrix, X
Connect Math to Graphics (Cont.) 2-d Toy Example Feature Space Object Space Sample Mean, X
Connect Math to Graphics (Cont.) 2-d Toy Example Feature Space Object Space Residuals from Mean = Data - Mean
Connect Math to Graphics (Cont.) 2-d Toy Example Feature Space Object Space Recentered Data = Mean Residuals, shifted to 0 = (rescaling of) X
Connect Math to Graphics (Cont.) 2-d Toy Example Feature Space Object Space PC1 Direction = η = Eigenvector (w/ biggest λ)
Connect Math to Graphics (Cont.) 2-d Toy Example Feature Space Object Space Centered Data PC1 ProjectionResidual
Connect Math to Graphics (Cont.) 2-d Toy Example Feature Space Object Space PC2 Direction = η = Eigenvector (w/ 2nd biggest λ)
Connect Math to Graphics (Cont.) 2-d Toy Example Feature Space Object Space Centered Data PC2 ProjectionResidual
Connect Math to Graphics (Cont.) Note for this 2-d Example: PC1 Residuals = PC2 Projections PC2 Residuals = PC1 Projections (i.e. colors common across these pics)
PCA Redistribution of Energy Convenient summary of amount of structure: Total Sum of Squares Physical Interpetation: Total Energy in Data Insight comes from decomposition Statistical Terminology: ANalysis Of VAriance (ANOVA)
PCA Redist’n of Energy (Cont.) ANOVA mean decomposition: Total Variation = = Mean Variation + Mean Residual Variation Mathematics: Pythagorean Theorem Intuition Quantified via Sums of Squares
Connect Math to Graphics (Cont.) 2-d Toy Example Feature Space Object Space Residuals from Mean = Data – Mean Most of Variation = 92% is Mean Variation SS Remaining Variation = 8% is Resid. Var. SS
PCA Redist’n of Energy (Cont.) Now decompose SS about the mean where: Energy is expressed in trace of covar’ce matrix
PCA Redist’n of Energy (Cont.) • Eigenvalues provide atoms of SS decomposi’n • Useful Plots are: • “Power Spectrum”: vs. • “log Power Spectrum”: vs. • “Cumulative Power Spectrum”: vs. • Note PCA gives SS’s for free (as eigenvalues), • but watch factors of
PCA Redist’n of Energy (Cont.) • Note, have already considered some of these Useful Plots: • Power Spectrum • Cumulative Power Spectrum
Connect Math to Graphics (Cont.) 2-d Toy Example Feature Space Object Space Revisit SS Decomposition for PC1: PC1 has “most of var’n” = 93% Reflected by good approximation in Object Space
Connect Math to Graphics (Cont.) 2-d Toy Example Feature Space Object Space Revisit SS Decomposition for PC1: PC2 has “only a little var’n” = 7% Reflected by poor approximation in Object Space
Different Views of PCA • Solves several optimization problems: • Direction to maximize SS of 1-d proj’d data • Direction to minimize SS of residuals • (same, by Pythagorean Theorem) • “Best fit line” to data in “orthogonal sense” • (vs. regression of Y on X = vertical sense • & regression of X on Y = horizontal sense) • Use one that makes sense…