Applying Random Effects Models in Statistical Analysis
250 likes | 381 Vues
Learn the principles and applications of random effects models, including hypothesis testing, estimating variance components, and calculating confidence intervals in STA305. Explore ANOVA tables, expected mean squares, and more.

Applying Random Effects Models in Statistical Analysis
E N D
Presentation Transcript
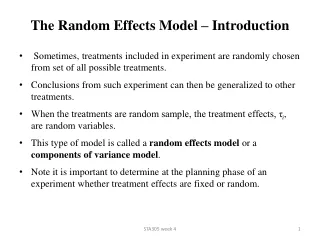
The Random Effects Model – Introduction • Sometimes, treatments included in experiment are randomly chosen from set of all possible treatments. • Conclusions from such experiment can then be generalized to other treatments. • When the treatments are random sample, the treatment effects, τi, are random variables. • This type of model is called a random effects model or a components of variance model. • Note it is important to determine at the planning phase of an experiment whether treatment effects are fixed or random. STA305 week 4
Example - Weaving Loom Homogeneity • Textile Company uses large number of looms to produce fabric. The looms function in uniform manner so fabric produced by company is of uniform strength. • To investigate whether there are any difference between looms, 4 looms will be selected at random from all those owned by company. • Four samples will be obtained from each loom. • Fixed or Random Effects? Since looms are randomly selected, a random effects model must be used. Results obtained from these 4 looms can be generalized to the set of all looms owned by company. STA305 week 4
The Random Effect Model • The equation for the statistical model remains the same as for fixed effects model is: Yij = μ + τi + εij . • As in the fixed effects model, the εij are assumed to be i.i.d. N(0, σ2). • However, unlike the fixed effects model, random effects model has treatment effects, τi, which are random variables. • Therefore, instead of assuming that , random effects model requires that E(τi) = 0. • Under this assumption, the overall mean is still μ. To see that this is the case, consider… • It is also assumed that: 1. the τi are statistically independent of the εij 2. that the τi are i.i.d STA305 week 4
Expected Mean Squares for Random Effects Model • To construct hypothesis test concerning treatment effects, we need to find expected mean squares. • Since τi are random, E(MSTreat) is not the same as in fixed effects model. • To find E(MSTreat) start by expressing the treatment sample means in terms of model parameters as follows:…. STA305 week 4
Hypothesis Testing • In a random effect model, testing for no treatment effect is in fact testing whether the variance of treatment effects is 0. • The Hypothesis are therefore: • When H0 is true, then it follows that E(MSTreat) = σ2 = E(MSE). • Otherwise, if H0 is false, then E(MSTreat) > σ2. • So the ratio of MSTreat to MSE provides a test statistic which is given by • The calculation of the P-value is then the same as for fixed effect model. That is, P-value = P(F(a-1, n-a) > Fobs). STA305 week 4
Analysis of Variance Table • The only aspect of ANOVA table that is different from fixed effects case is E(MSTreat). • The ANOVA table for random effect model is given below STA305 week 4
Estimating the Variance Components • In a random effects model, both σ2 and are known as the components of variation. • Point estimates of these quantities can be obtained by using information contained in the ANOVA table. • As we can see the MSE is unbiased estimate of σ2. • Exercise: Show that an unbiased estimate of is: STA305 week 4
Proportion of Variance Explained • The total variation in Yij is therefore, the proportion of variance explained by the treatment is: • An estimate of this proportion can be obtained by substituting into the equation above. STA305 week 4
Confidence Interval for Variance Component • Confidence interval is useful for assessing amount of treatment variability relative to error variability. • That is, we want a CI for • It can be shown that: • Further, to use Cochrane’s theorem, we divide each of the above by its degrees of freedom and take ratio. We get… • This can be used to derive a confidence interval for by taking the following steps… STA305 week 4
Example Weaving Looms Continued • Recall, 4 looms randomly selected from all those owned by the company. • Four cloth samples obtained from each loom & strength is recorded. • The data is given in the following table: STA305 week 4
Using SAS to Conduct ANOVA • To conduct ANOVA in SAS we need to add a RANDOM statement. The code is then, proc glm data = looms ; class loom ; model strength = loom ; RANDOM loom ; run ; • The extra line in the code generated information regarding E(MSTreat). • The output is given in the following slide (slide 12). • Exercise, verify that E(MSTreat) is as stated in output… STA305 week 4
Factorial Designs – Introduction • In a factorial design experiments, at least 2 factors are studied for their simultaneous impact on the response. • Suppose there are 2 factors, A and B where A has levels 1, 2, . . . , a and B has levels 1, 2, . . . , b. • Every level of A will be used with every level of B. That is, there are a × b possible treatment combinations. • The experimental units are randomly assigned to the treatments. • In this type of design factors are said to be crossed. STA305 week 4
Advantages and Disadvantages of Factorial Designs Advantage s • Factorial designs are more efficient than doing multiple studies to examine one factor at a time. • They provide information about joint impact of factors on response. Disadvantage • Studies with many factors can be complex and costly to design and execute. • Further, if too many factors are included, it may result in insufficient degrees of freedom for estimating variability due to experimental error. STA305 week 4
Example - Toxins and Their Antidotes • Three toxic agents are thought to have varying impacts on survival time. • Four potential poison antidotes are also to be studied to determine if they also had an impact on survival, in the presence of a toxic agent. • Four different animals were randomly allocated to each of the 12 treatments. • The mean survival times for 4 animals exposed to each treatment are given in the Table below: STA305 week 4
To see relationship between toxic agent, antidote, and survival time, it is useful to plot mean survival times. The plot is given below: STA305 week 4
As we can see, for antidotes B1, B2, and B3, toxic agent A1 has the greatest mean survival time, followed by A2, and then A3. • For antidote B4 there is a different pattern. • Also notice that the plots for antidotes B1 and B3 are almost parallel but those for B2 and B4 are very different. • It appears that there is an interaction between toxic agents and antidotes. STA305 week 4
Understanding Interaction • If there is no interaction between factors A and B then plot should contain approximately parallel curves. • Variability in data can be explained as a contribution due to factor A and a contribution due to factor B. • However, in presence of interaction, contributions by factors A and B don’t explain all of the differences seen in the data. • There is also a contribution associated with each particular combination of A and B. • The following figures illustrate what might be expected when there is or isn’t an effect of Factor A, Factor B, or an interaction effect. STA305 week 4